From the first cold snap to the green bean casserole rush, here's what 2025 Instacart orders reveal about how we shop for soup.
Key takeaways
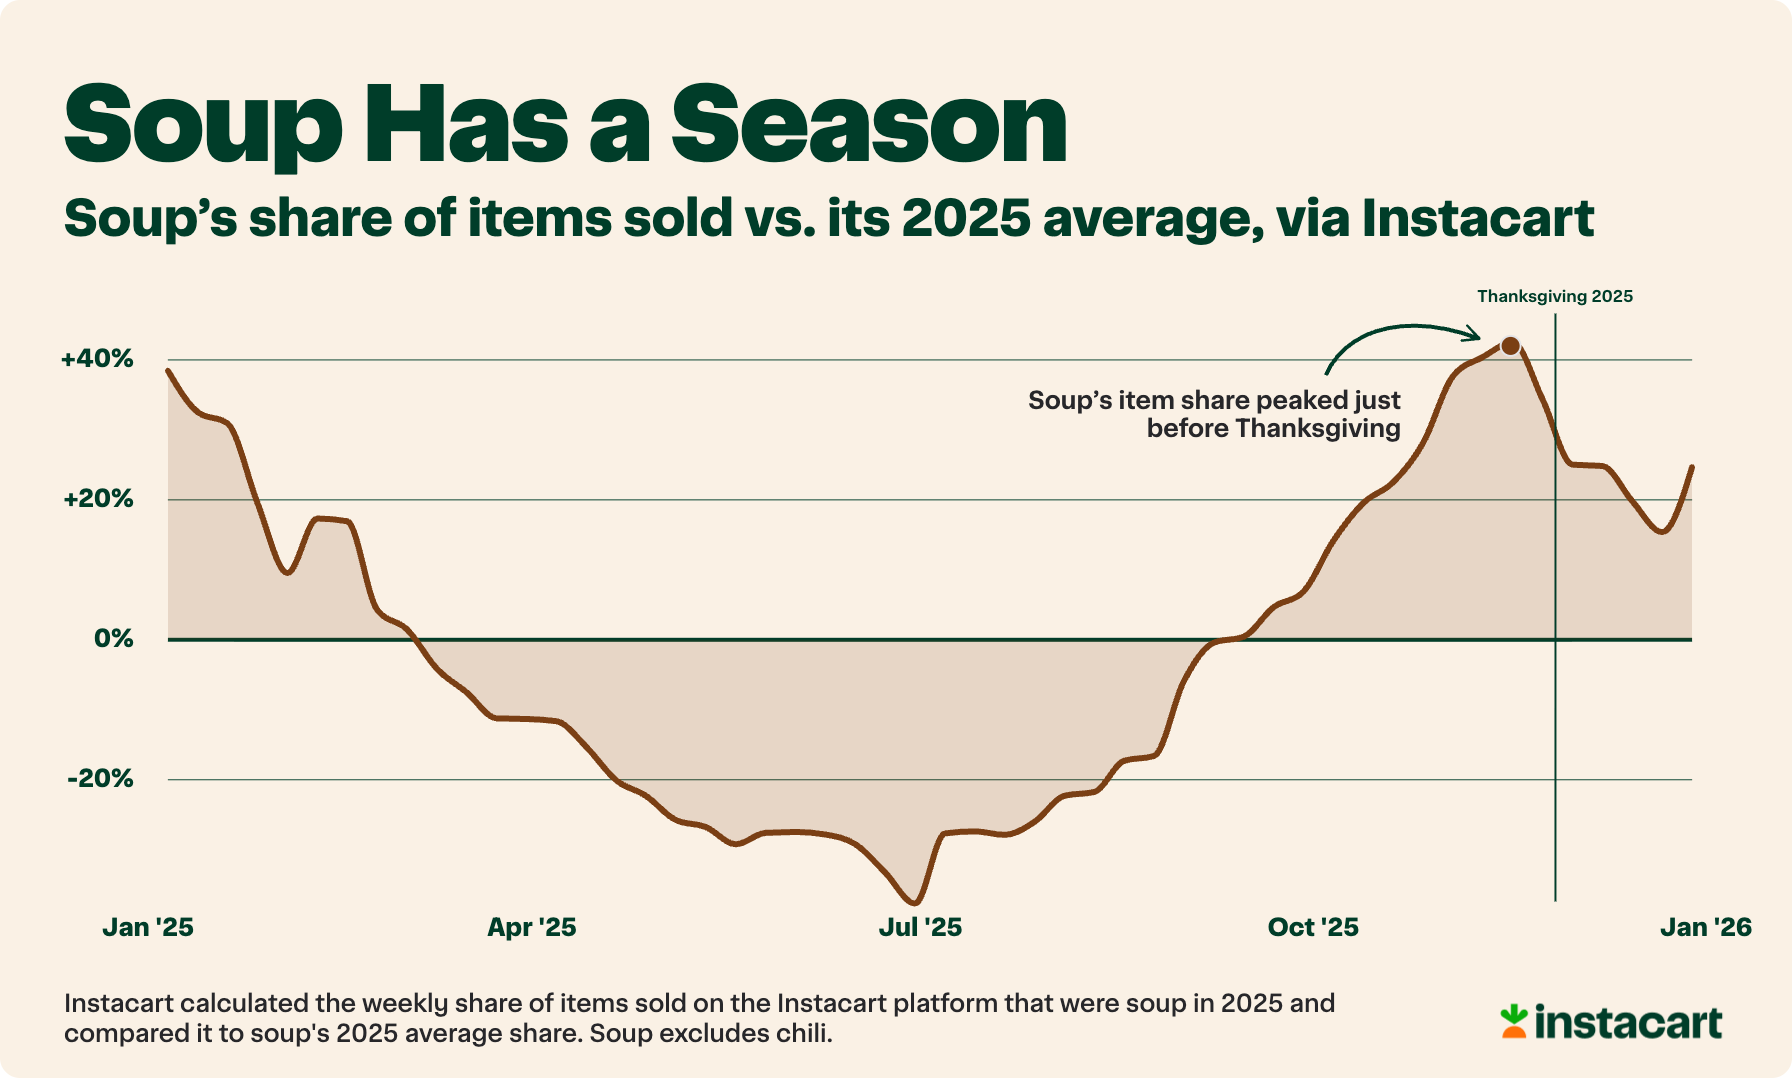
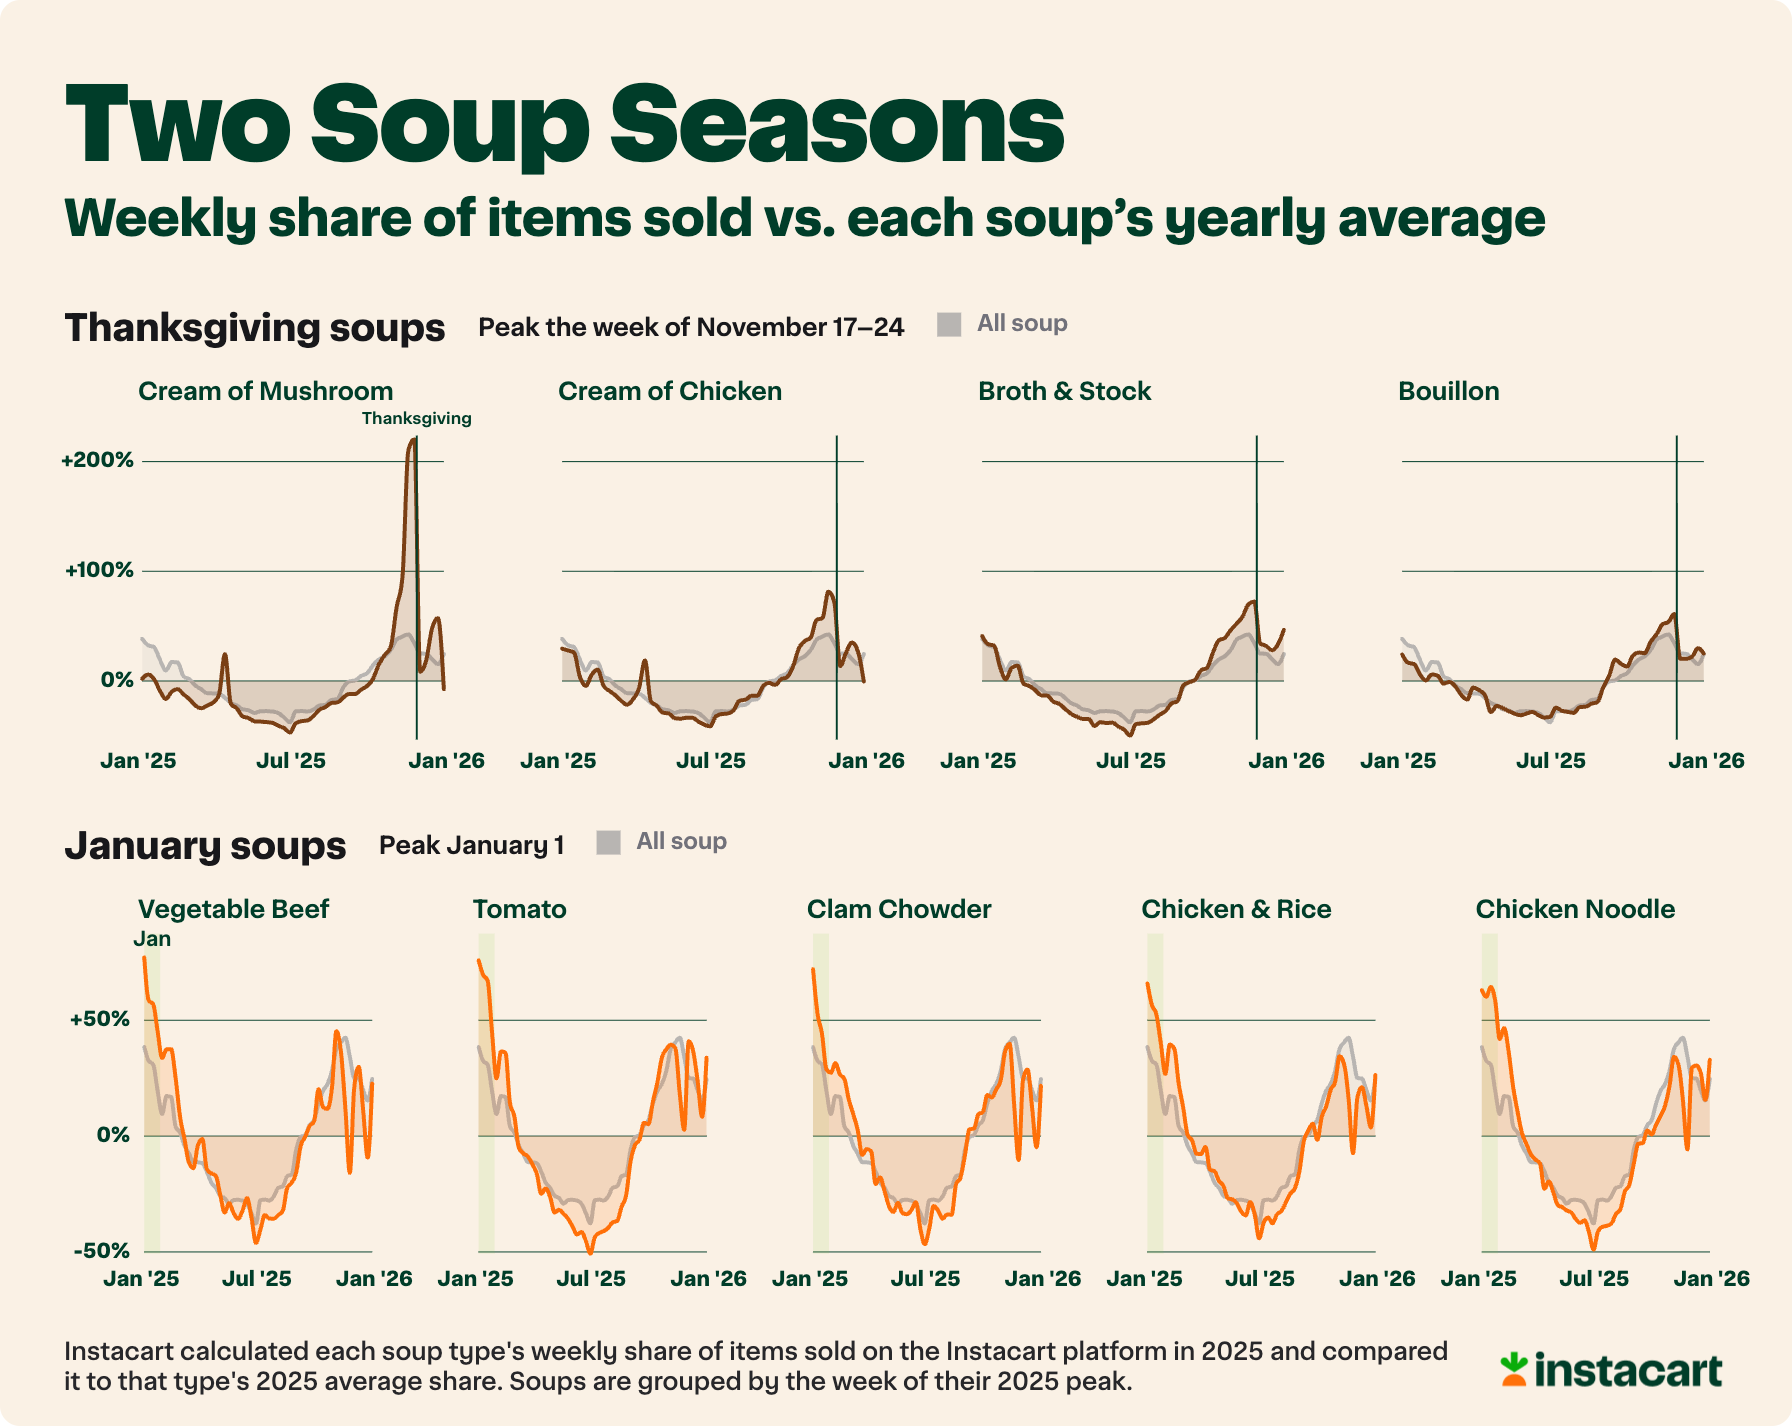
Soup peaks before Thanksgiving, not in January. Soup's share of the cart hits +42% above its yearly average the week of November 17.
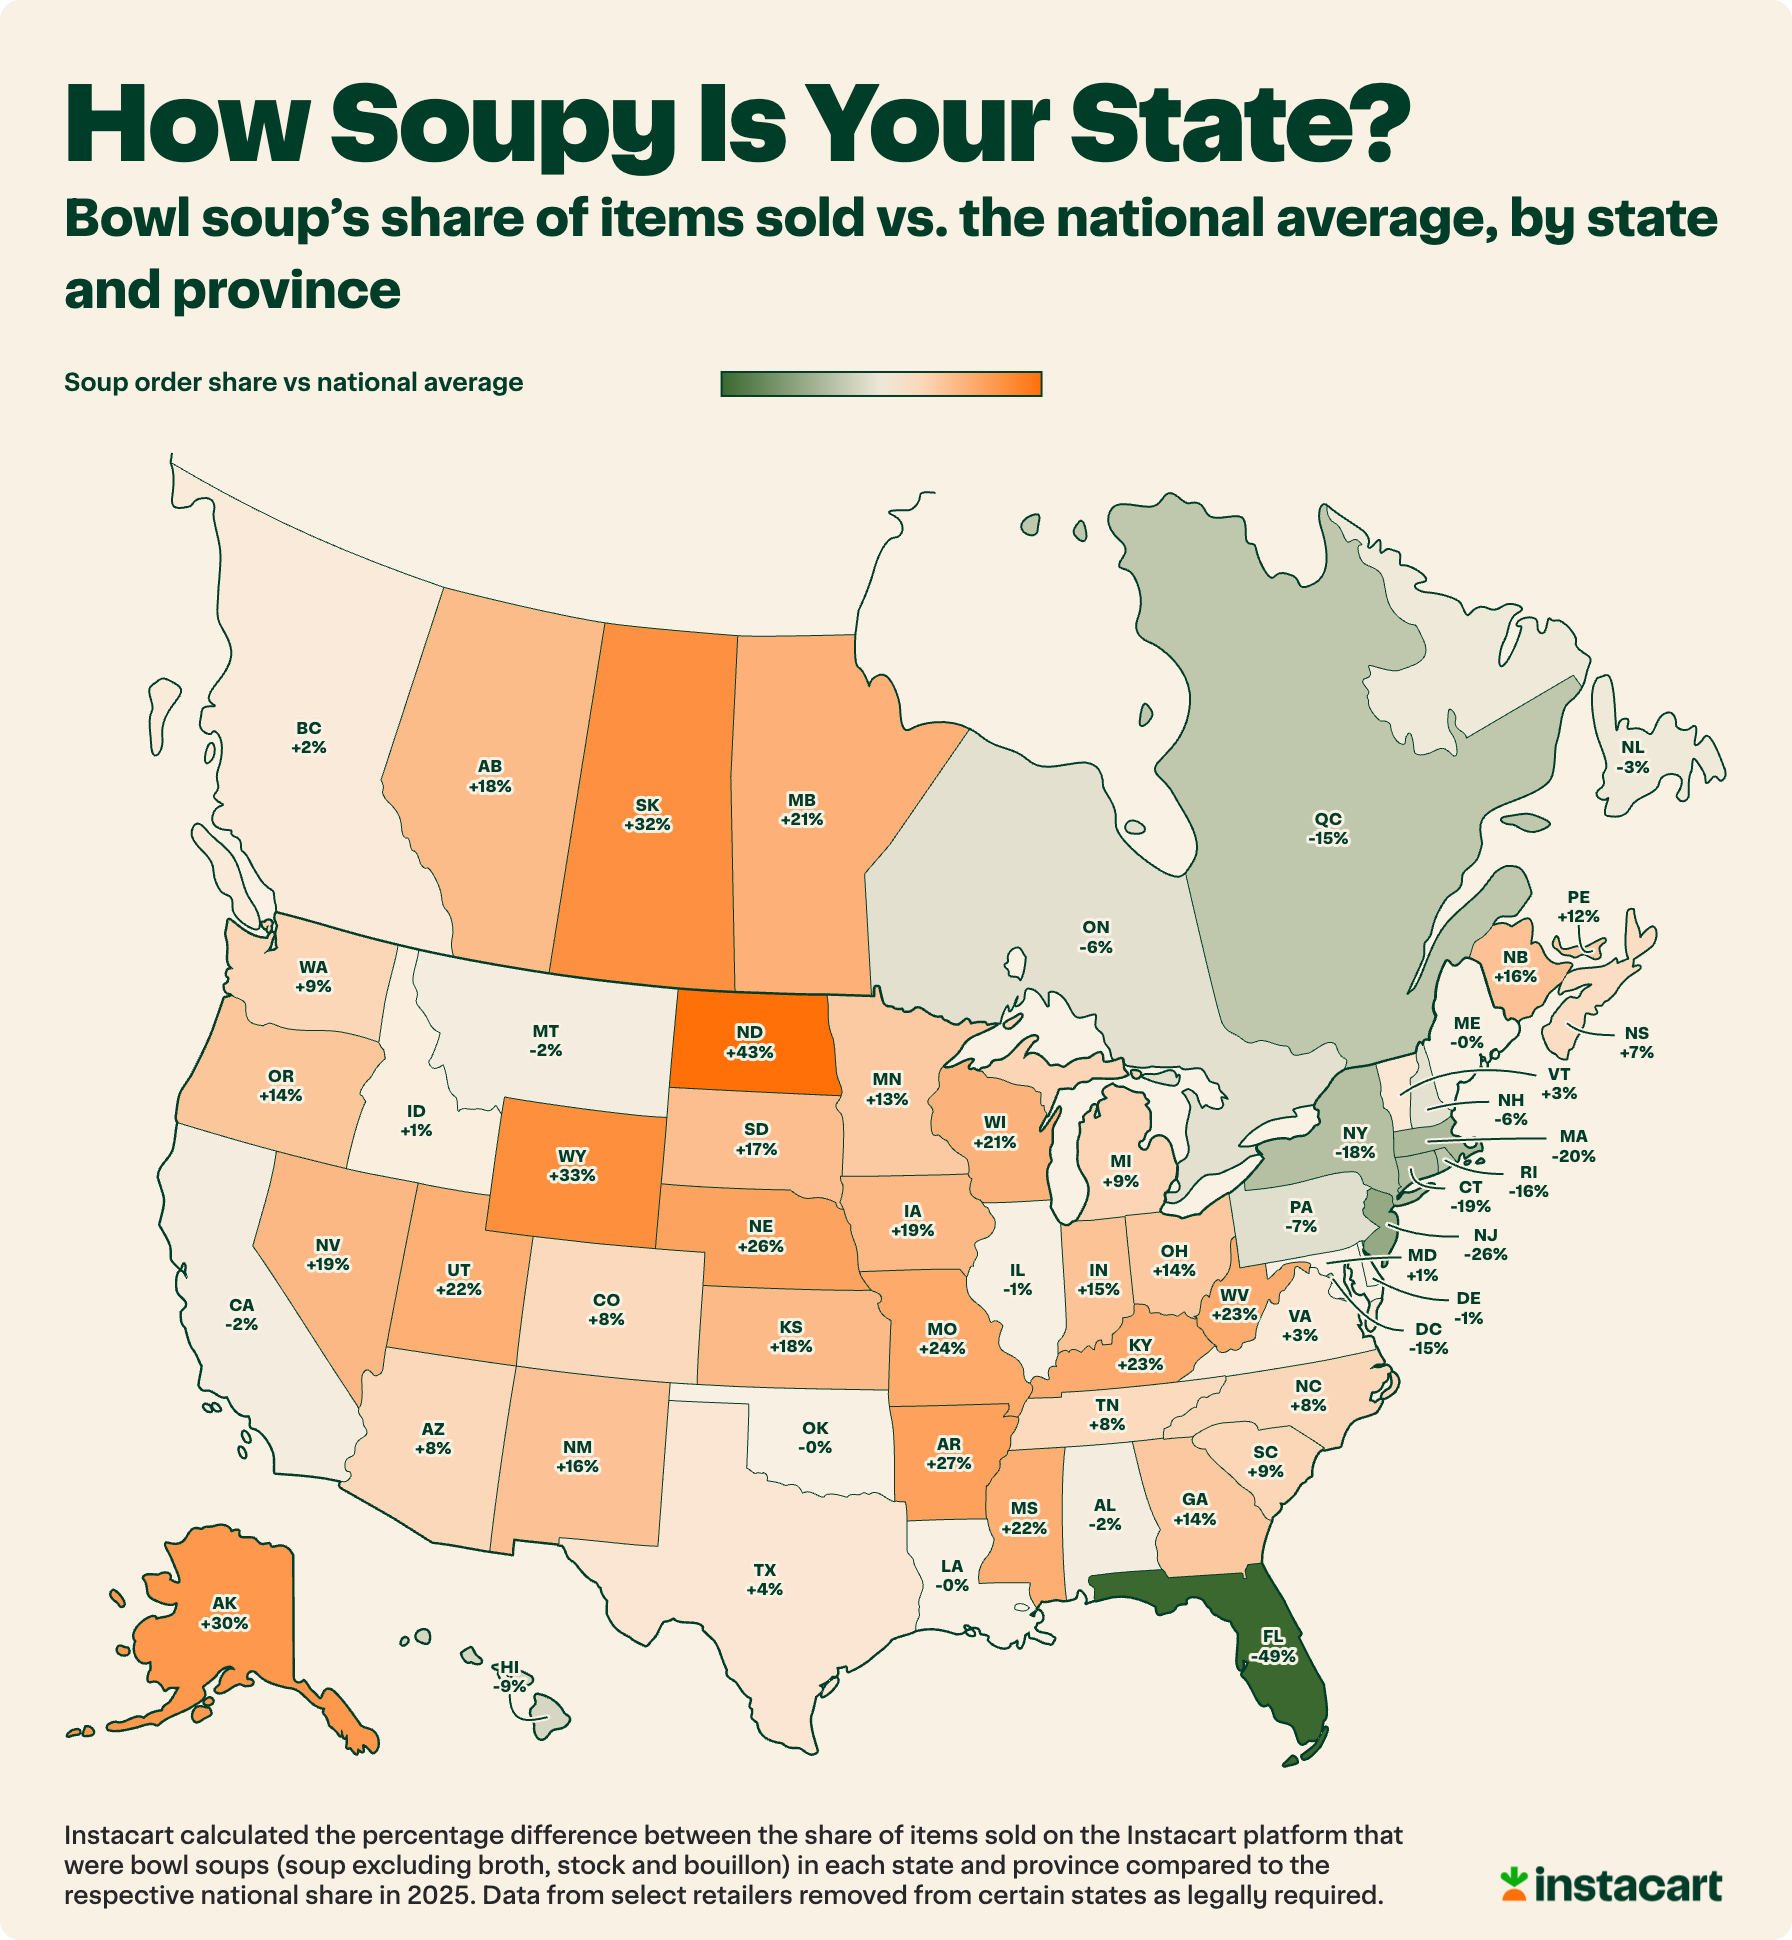
North Dakota buys soup most often. Its share of soup (not counting broth) runs +43% above the national average, ahead of Wyoming (+33%) and Alaska (+30%), while New Jersey (-26%) and Massachusetts (-20%) sit near the bottom.
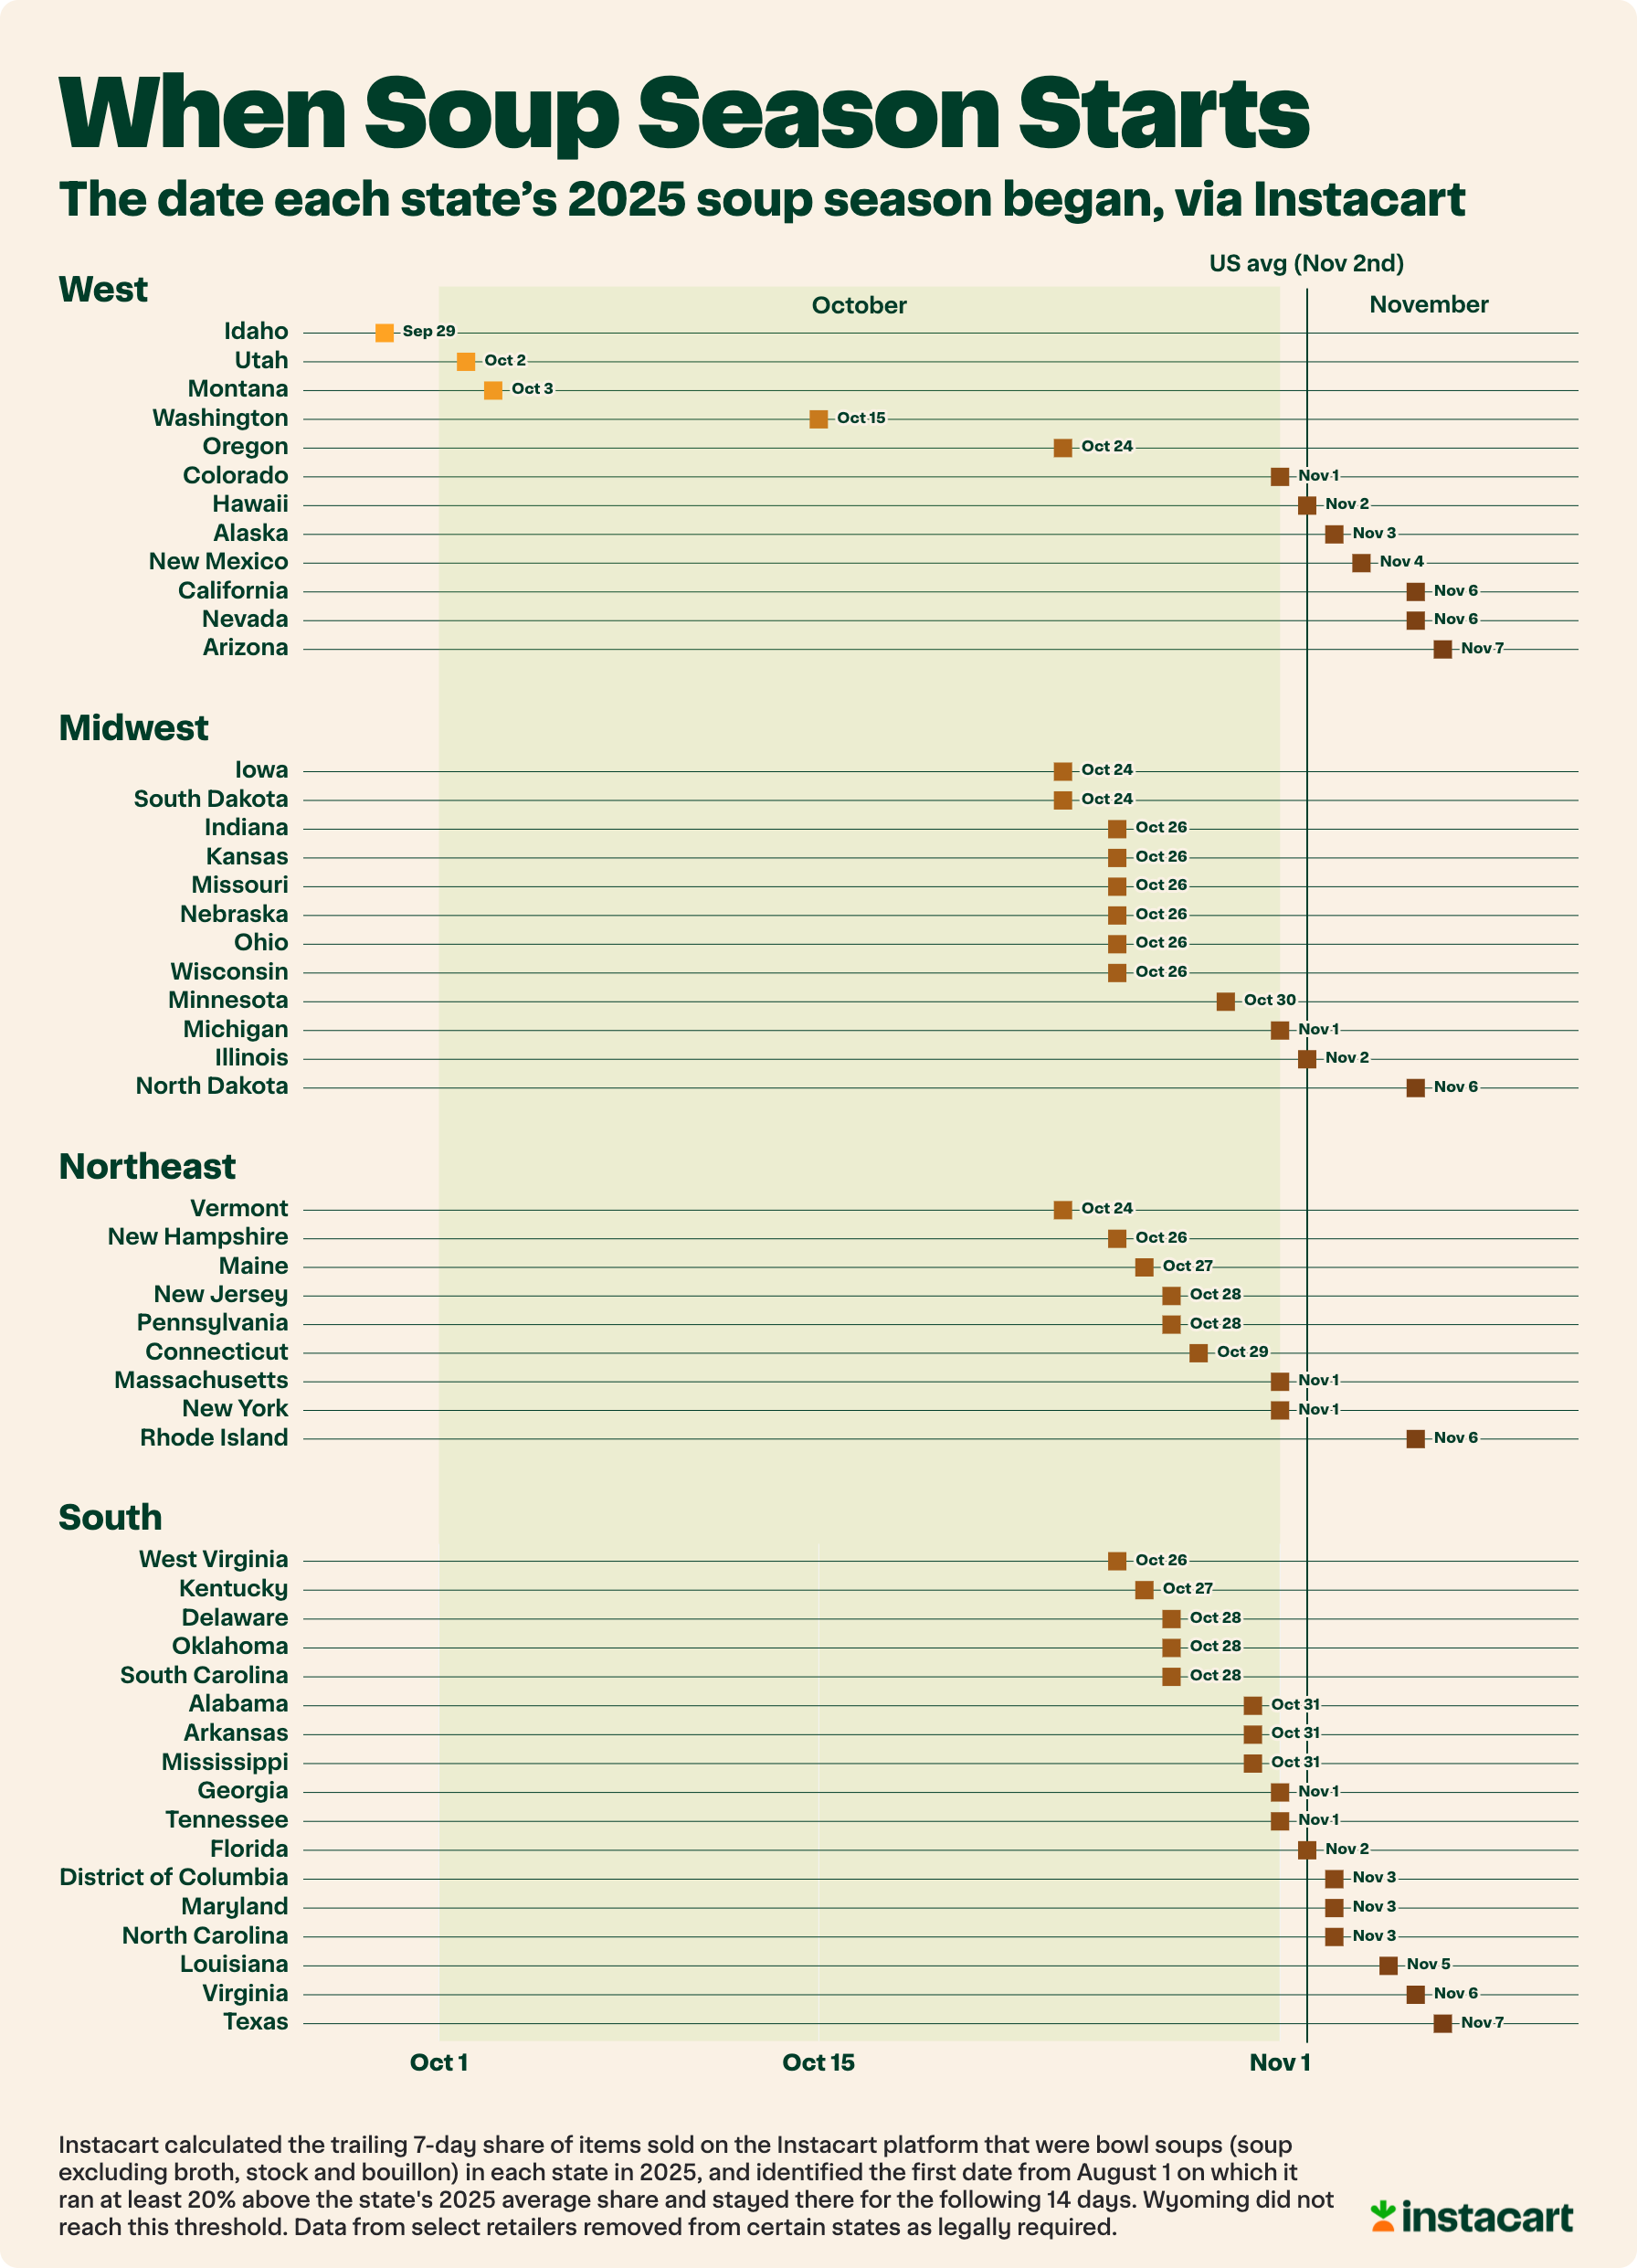
Idaho started soup season first. It kicked off on September 29, 2025, more than a month before the U.S. as a whole (November 2) and Arizona and Texas (November 7).
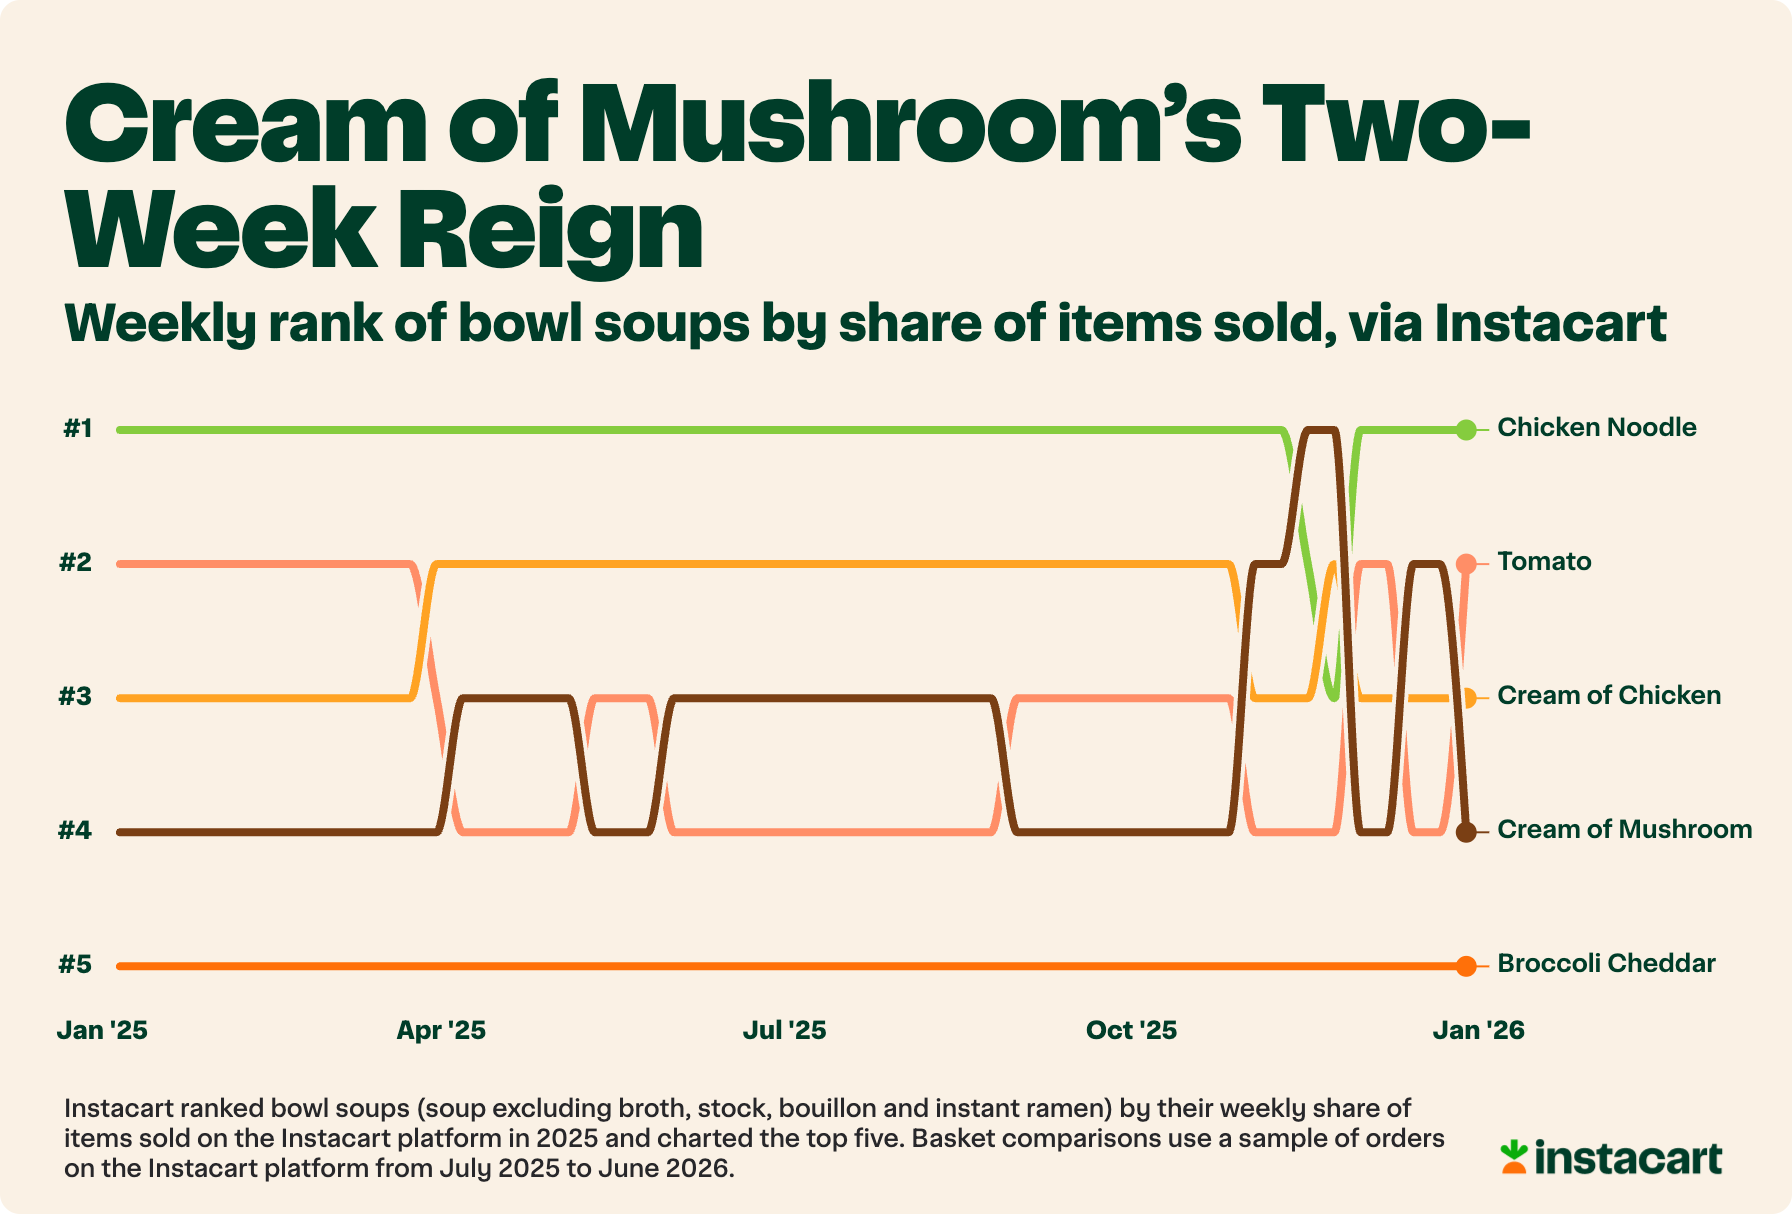
Cream of Mushroom dethrones Chicken Noodle, for exactly two weeks. It peaks at +220% above its yearly average around Thanksgiving, and orders with it are 39x as likely to include crispy fried onions.
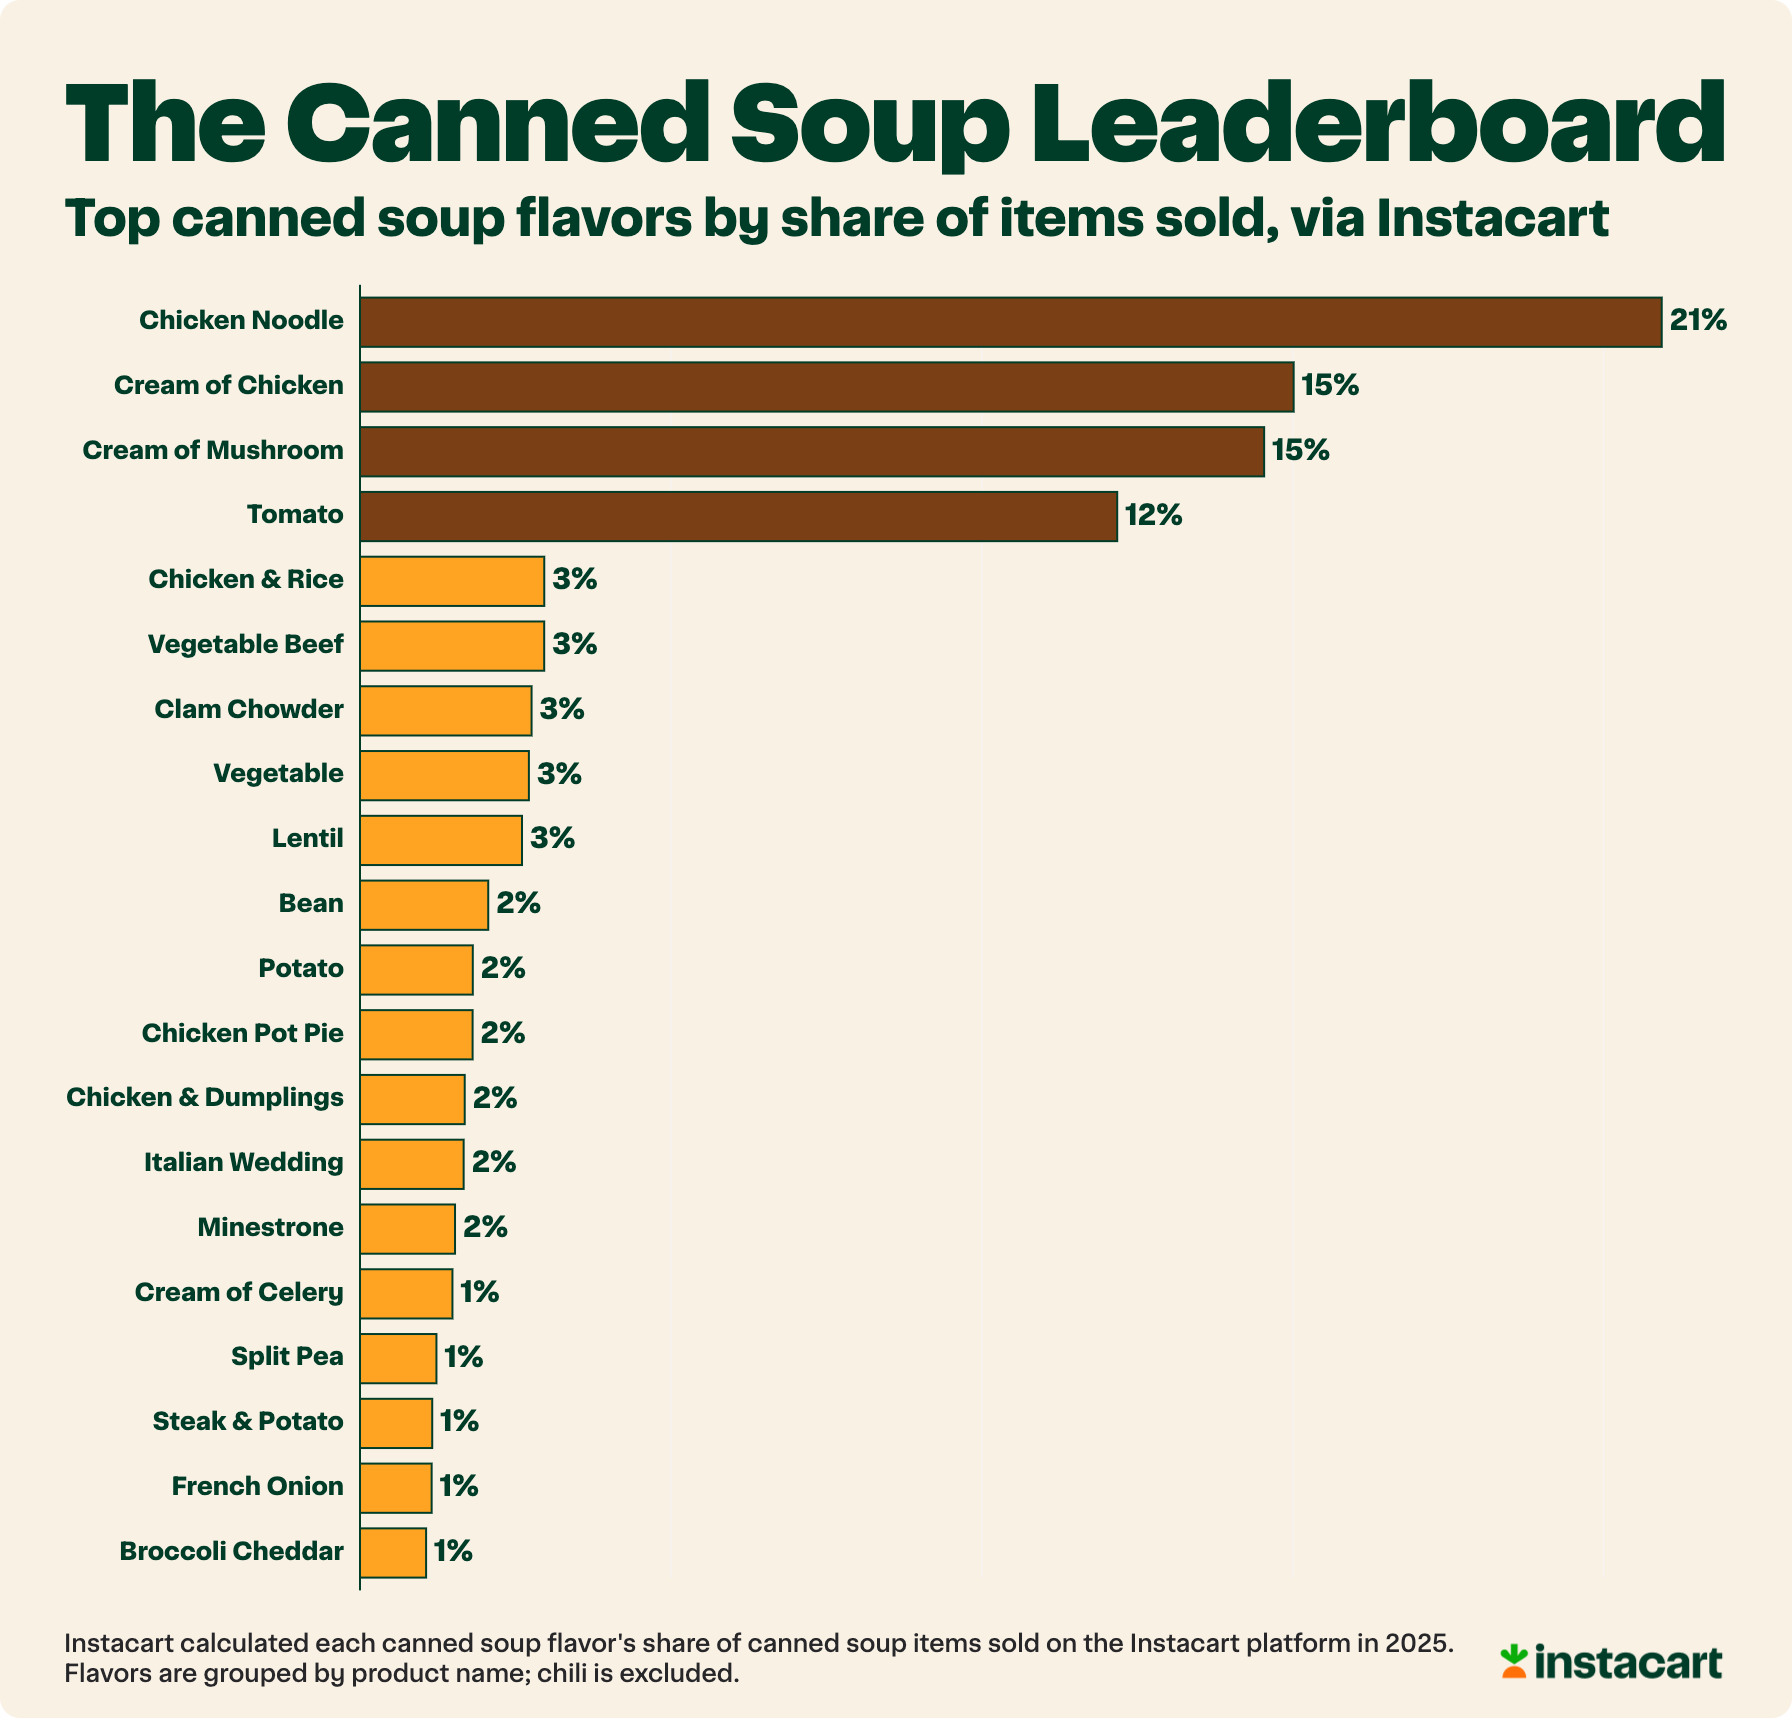
Four cans run the canned aisle. Chicken Noodle, Cream of Chicken, Cream of Mushroom and Tomato make up 63% of canned soup.
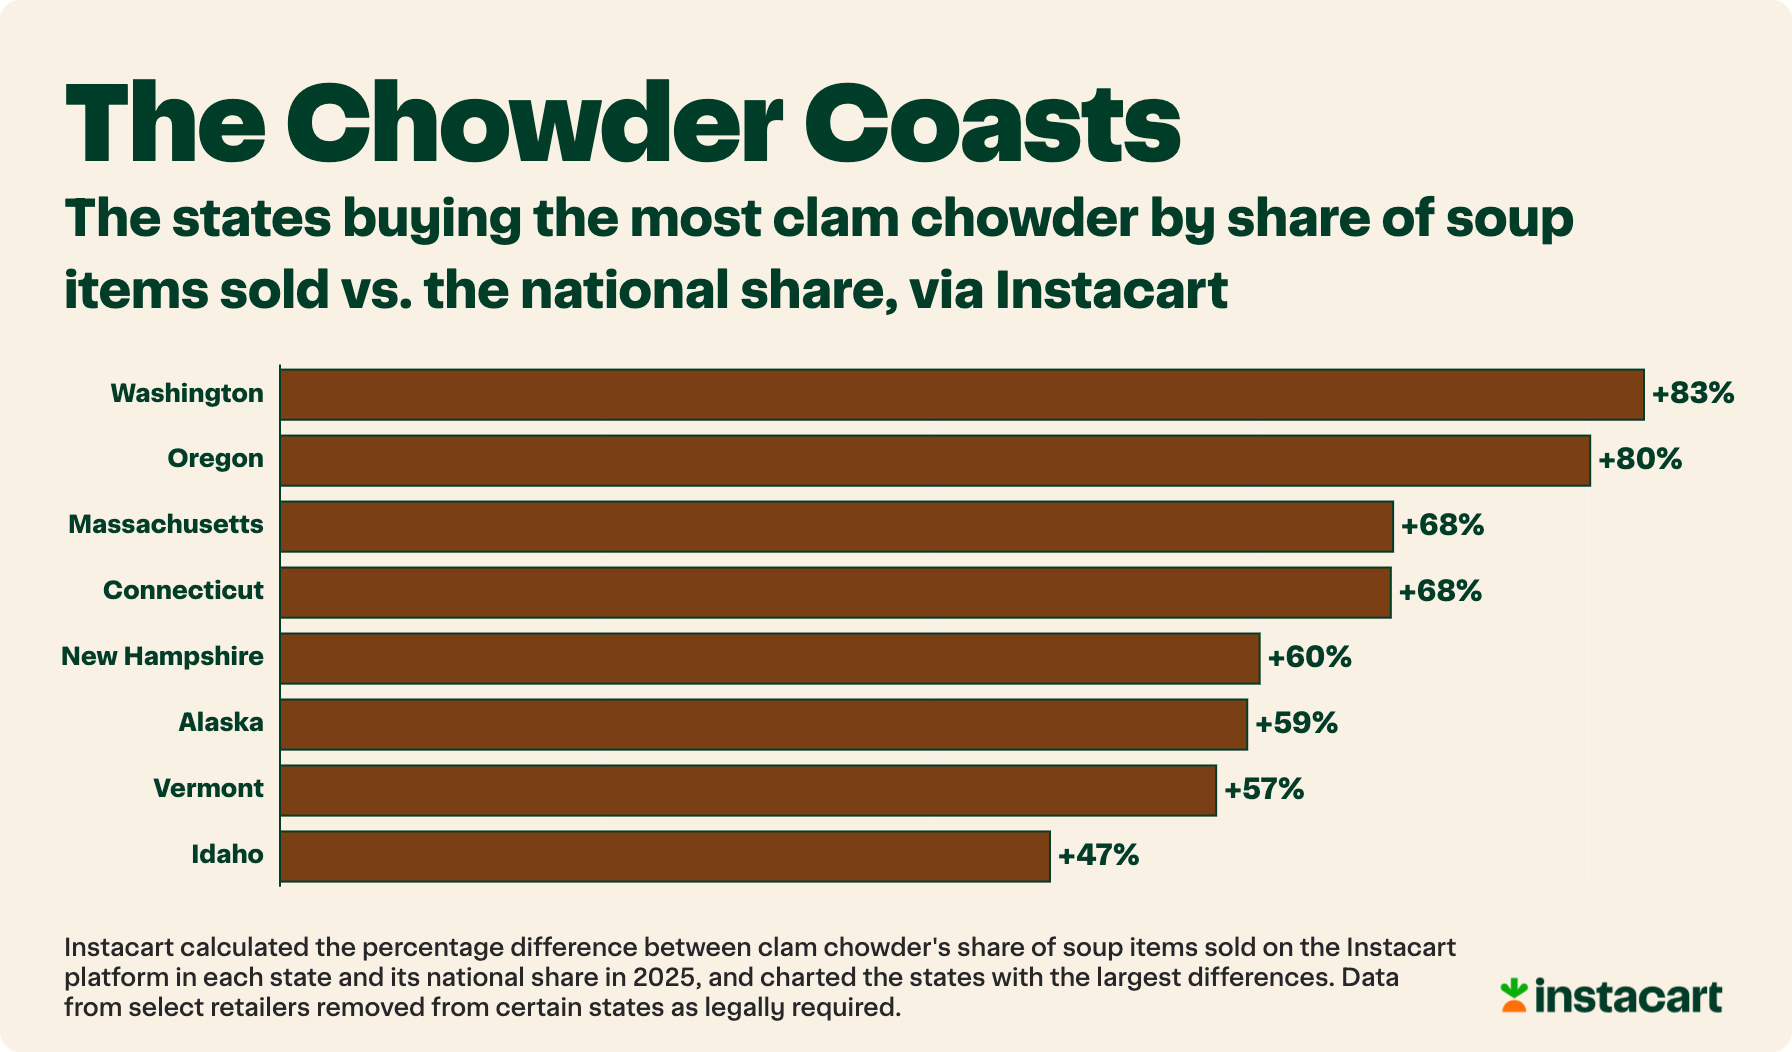
The Pacific Northwest out-chowders New England. Washington (+83%) and Oregon (+80%) buy clam chowder more often, relative to the nation, than any New England state. 🦪
Soup season might not start when you'd think, and it might not peak when you'd think either. We dug into 2025 Instacart orders to find out when people stock up, which states buy soup most often, which can each state reaches for, and what ends up in the cart next to it. Fair warning: it involves a surprising amount of crispy fried onions. 🥣
When Do People Actually Buy Soup? 🗓️
If your guess is January, you're close, but the calendar says otherwise. Soup's share of the cart rises steadily through the autumn months and peaks the week of November 17, when it runs +42% above its yearly average, the week before Thanksgiving.
The low point is the week of June 30, when soup's share sits 38% below its yearly average. Fair enough: far fewer people are ladling up soup ahead of the Fourth of July.
Which States Buy Soup Most Often? 📍
For this question, we focused on bowl soups: everything in the soup aisle except broth, stock and bouillon, which often go into other recipes rather than straight into a bowl.
The coldest states aren't the whole story. North Dakota reaches for bowl soups more often than any other state or province, with a share +43% above the national average, followed by Wyoming (+33%), Saskatchewan (+32%) and Alaska (+30%). Rounding out the top eight are Arkansas (+27%), Nebraska (+26%), Missouri (+24%) and Kentucky (+23%).
On the other end of the map sit New Jersey (-26%), Massachusetts (-20%), Connecticut (-19%) and New York (-18%). This one looks less like north vs. south and more like the heartland vs. the coasts.
Does It Hold Up City by City? 🏙️
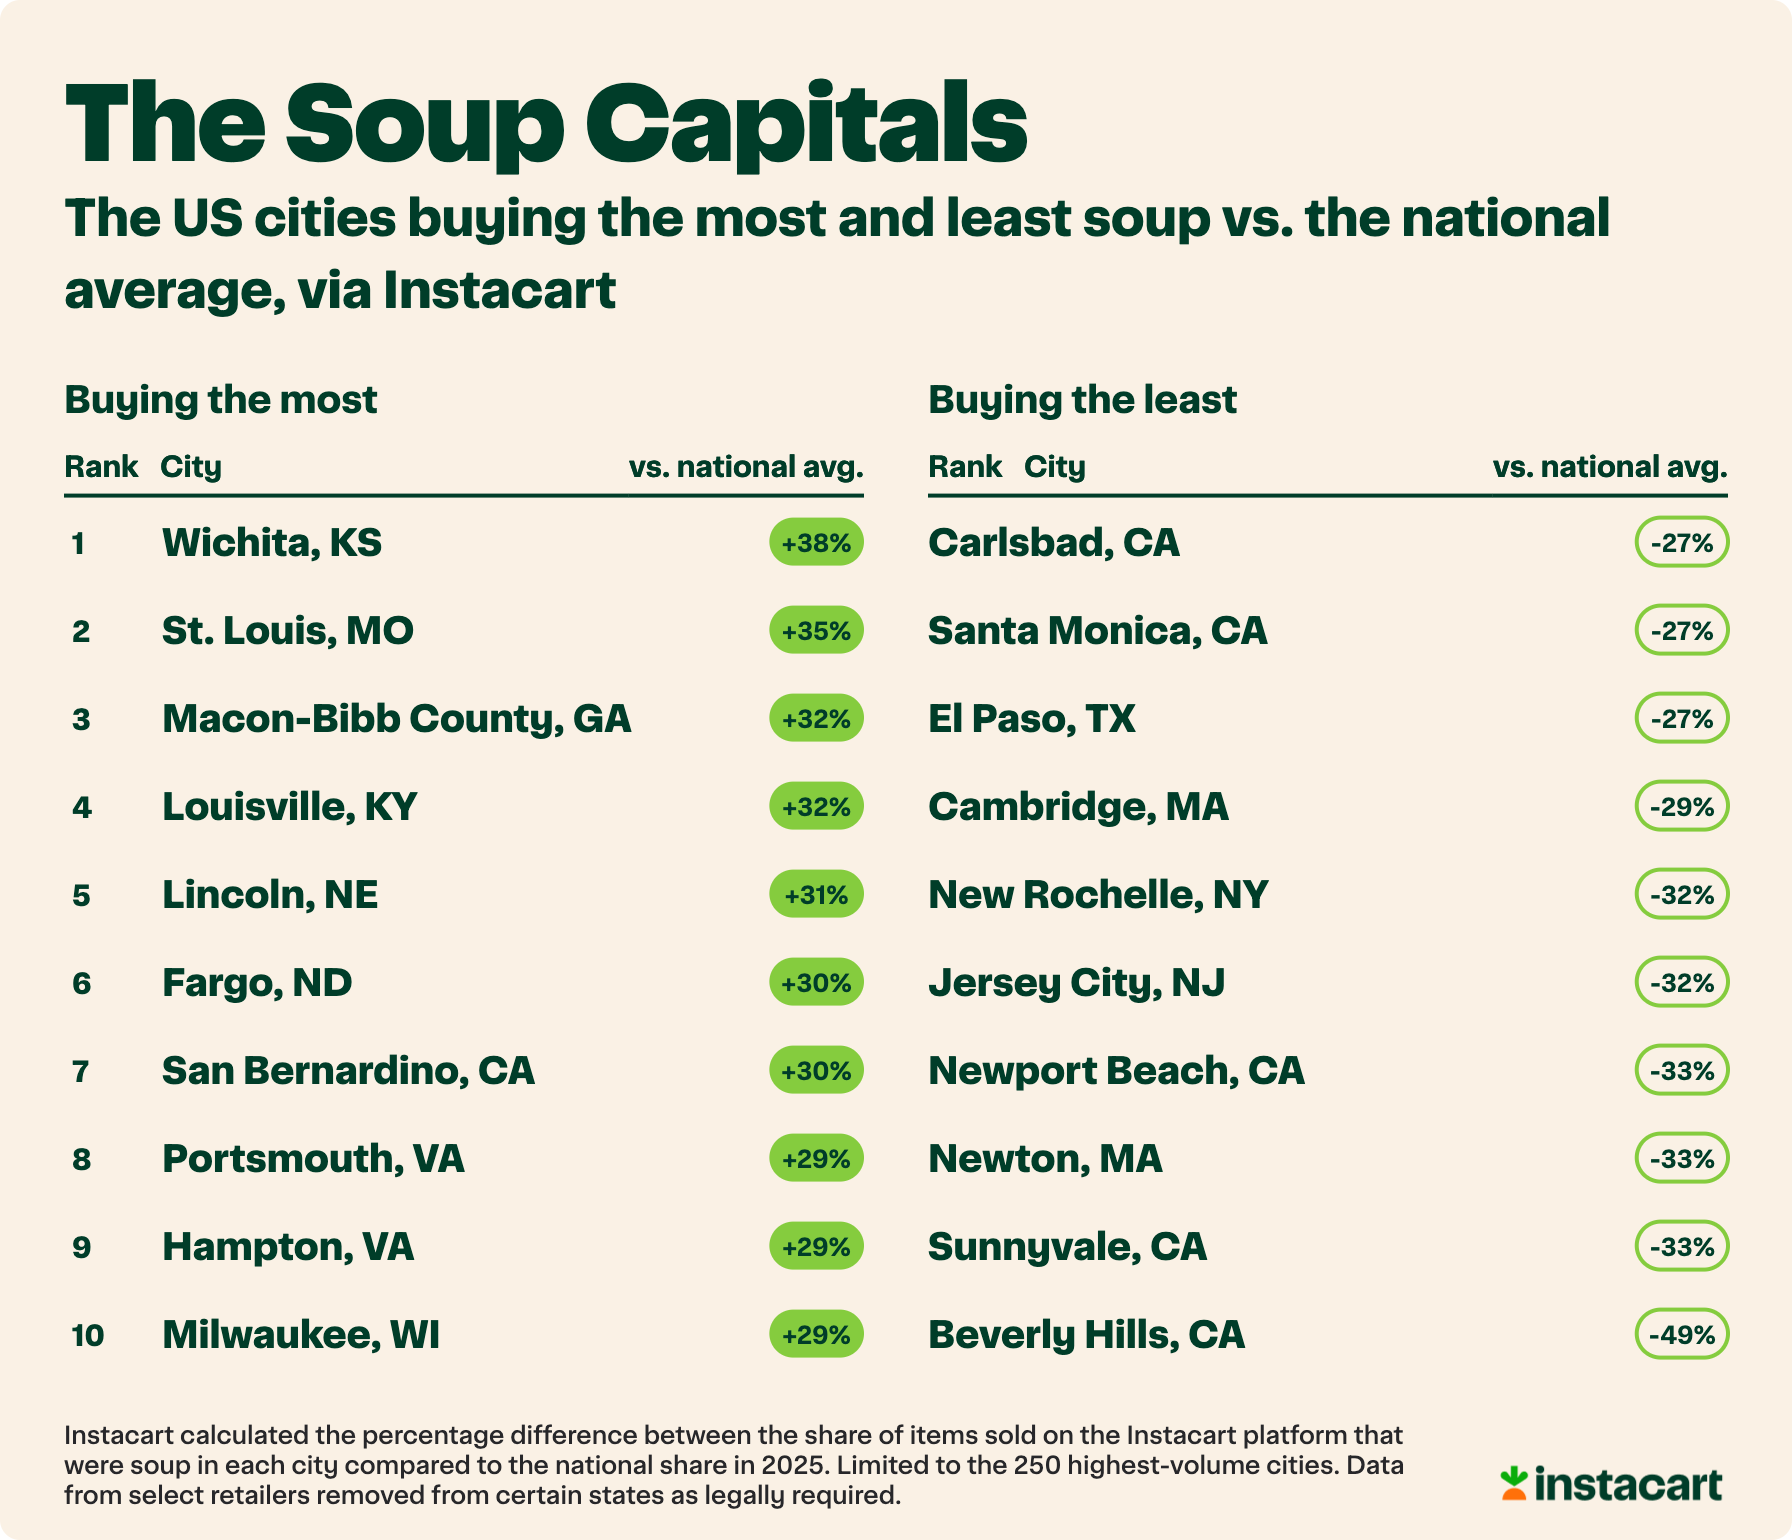
Mostly, yes. Wichita, KS (+38%) and St. Louis (+35%) top the list of soup capitals, followed by Macon, GA (+32%), Louisville, KY (+32%), Lincoln, NE (+31%) and Fargo, ND (+30%).
Nine of the ten cities buying the least soup are in California or the Northeast, led by Beverly Hills, CA (-49%), Newport Beach, CA (-33%), Newton, MA (-33%), Sunnyvale, CA (-33%) and New Rochelle, NY (-32%).
Does Soup Season Start at the Same Time in Every State? ⏱️
No. To find out when soup season starts, we marked the first day each state's bowl-soup buying ran at least 20% above its yearly norm and stayed there for two weeks. Idaho kicked off soup season first in 2025, on September 29, followed by Utah (Oct 2), Montana (Oct 3) and Washington (Oct 15).
Most Midwest and Northeast states got there between October 24 and November 2, and so did the U.S. as a whole (November 2). The last states to start were California, Nevada, North Dakota, Rhode Island and Virginia (Nov 6), and Arizona and Texas (Nov 7). In other words, the Mountain West gets the first spoonful and the Sun Belt gets the last.
Does Every Soup Peak at the Same Time? 🍲
Look closer at that single curve from the top of this report and it splits in two. Thanksgiving soups are mostly cooking soups: Cream of Mushroom (+220% above its yearly average at its peak), Cream of Chicken (+81%), Broth & Stock (+72%) and Bouillon (+61%) all peak the week of November 17 or 24.
January soups are classic bowls of soup: Vegetable Beef (+77%), Tomato (+76%), Clam Chowder (+72%), Chicken & Rice (+66%) and Chicken Noodle (+64%) all peak in January.
How Big Is the Thanksgiving Swing? 🦃
Big enough to knock Chicken Noodle off its throne. Among bowl soups (not counting instant ramen), it's No. 1 on Instacart in 50 of 52 weeks. The two exceptions are the weeks of November 17 and 24, when Cream of Mushroom takes over.
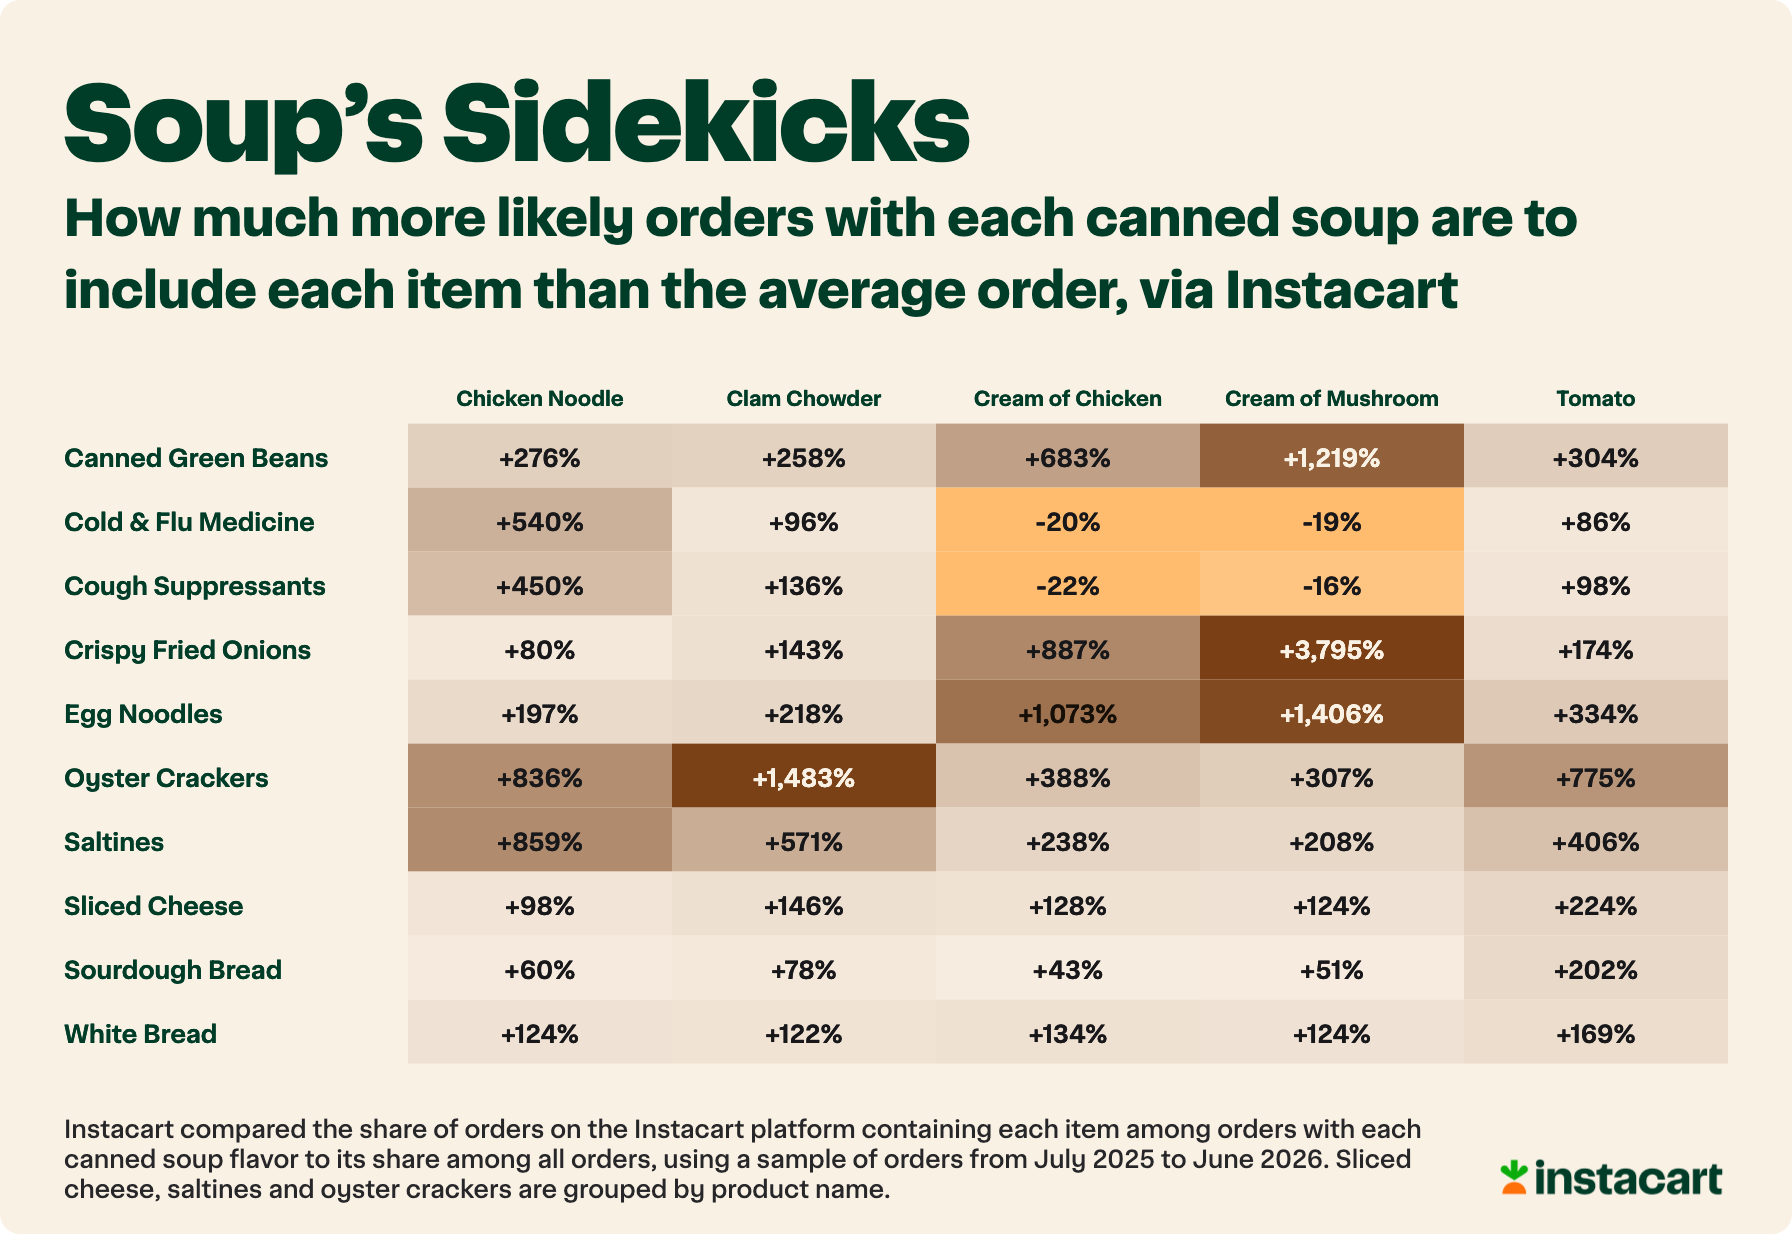
A lot of that Cream of Mushroom looks headed for a casserole dish: orders with it are 39x as likely to include crispy fried onions (+3,795%) and 13x as likely to include canned green beans (+1,219%). Green bean casserole, we see you. 👀
What's Actually in the Cans? 🥫
To compare states on an even playing field, we zoomed in on one shelf: canned soup. Four cans make up 63% of the canned soup aisle: Chicken Noodle (20.9%), Cream of Chicken (15.0%), Cream of Mushroom (14.5%) and Tomato (12.2%). No other flavor reaches 3%.
Which of the Big Four Wins Where? 🗺️
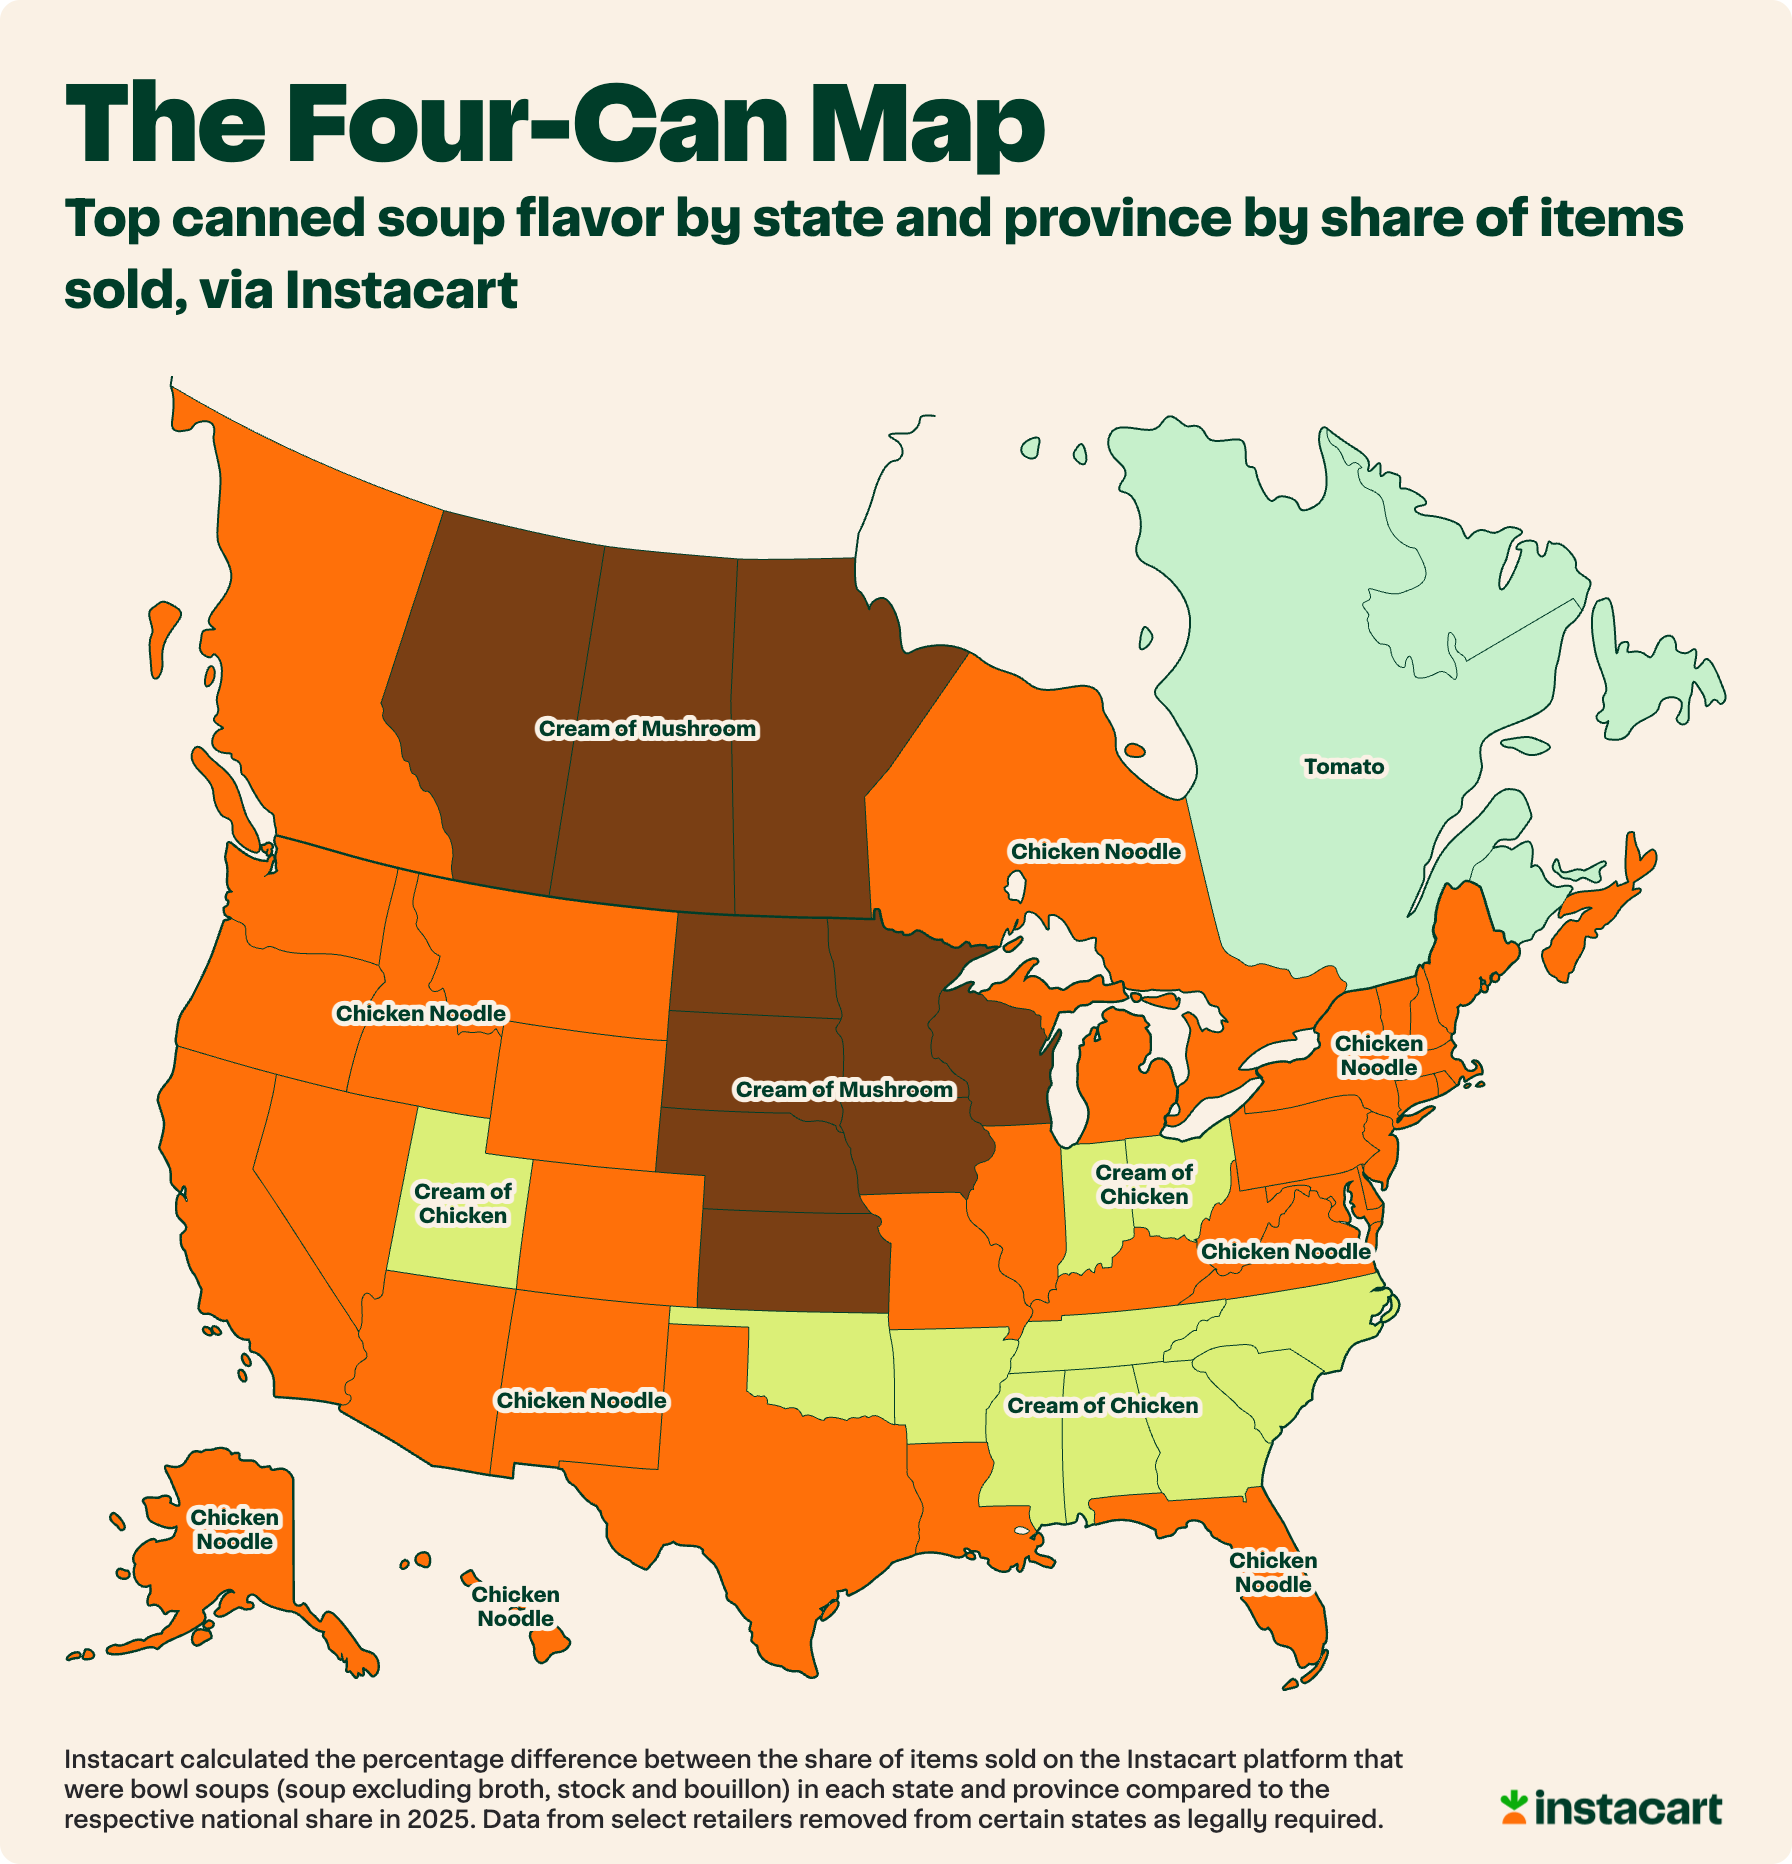
Chicken Noodle is the top can in 36 states and provinces. The other three each have a home turf: Cream of Chicken across the South (plus Ohio, Indiana, Oklahoma and Utah), Cream of Mushroom across the Upper Midwest and the Prairie provinces, and Tomato in Quebec, New Brunswick, Newfoundland and Labrador, and Prince Edward Island.
What Is Each State's Standout Soup? ⭐
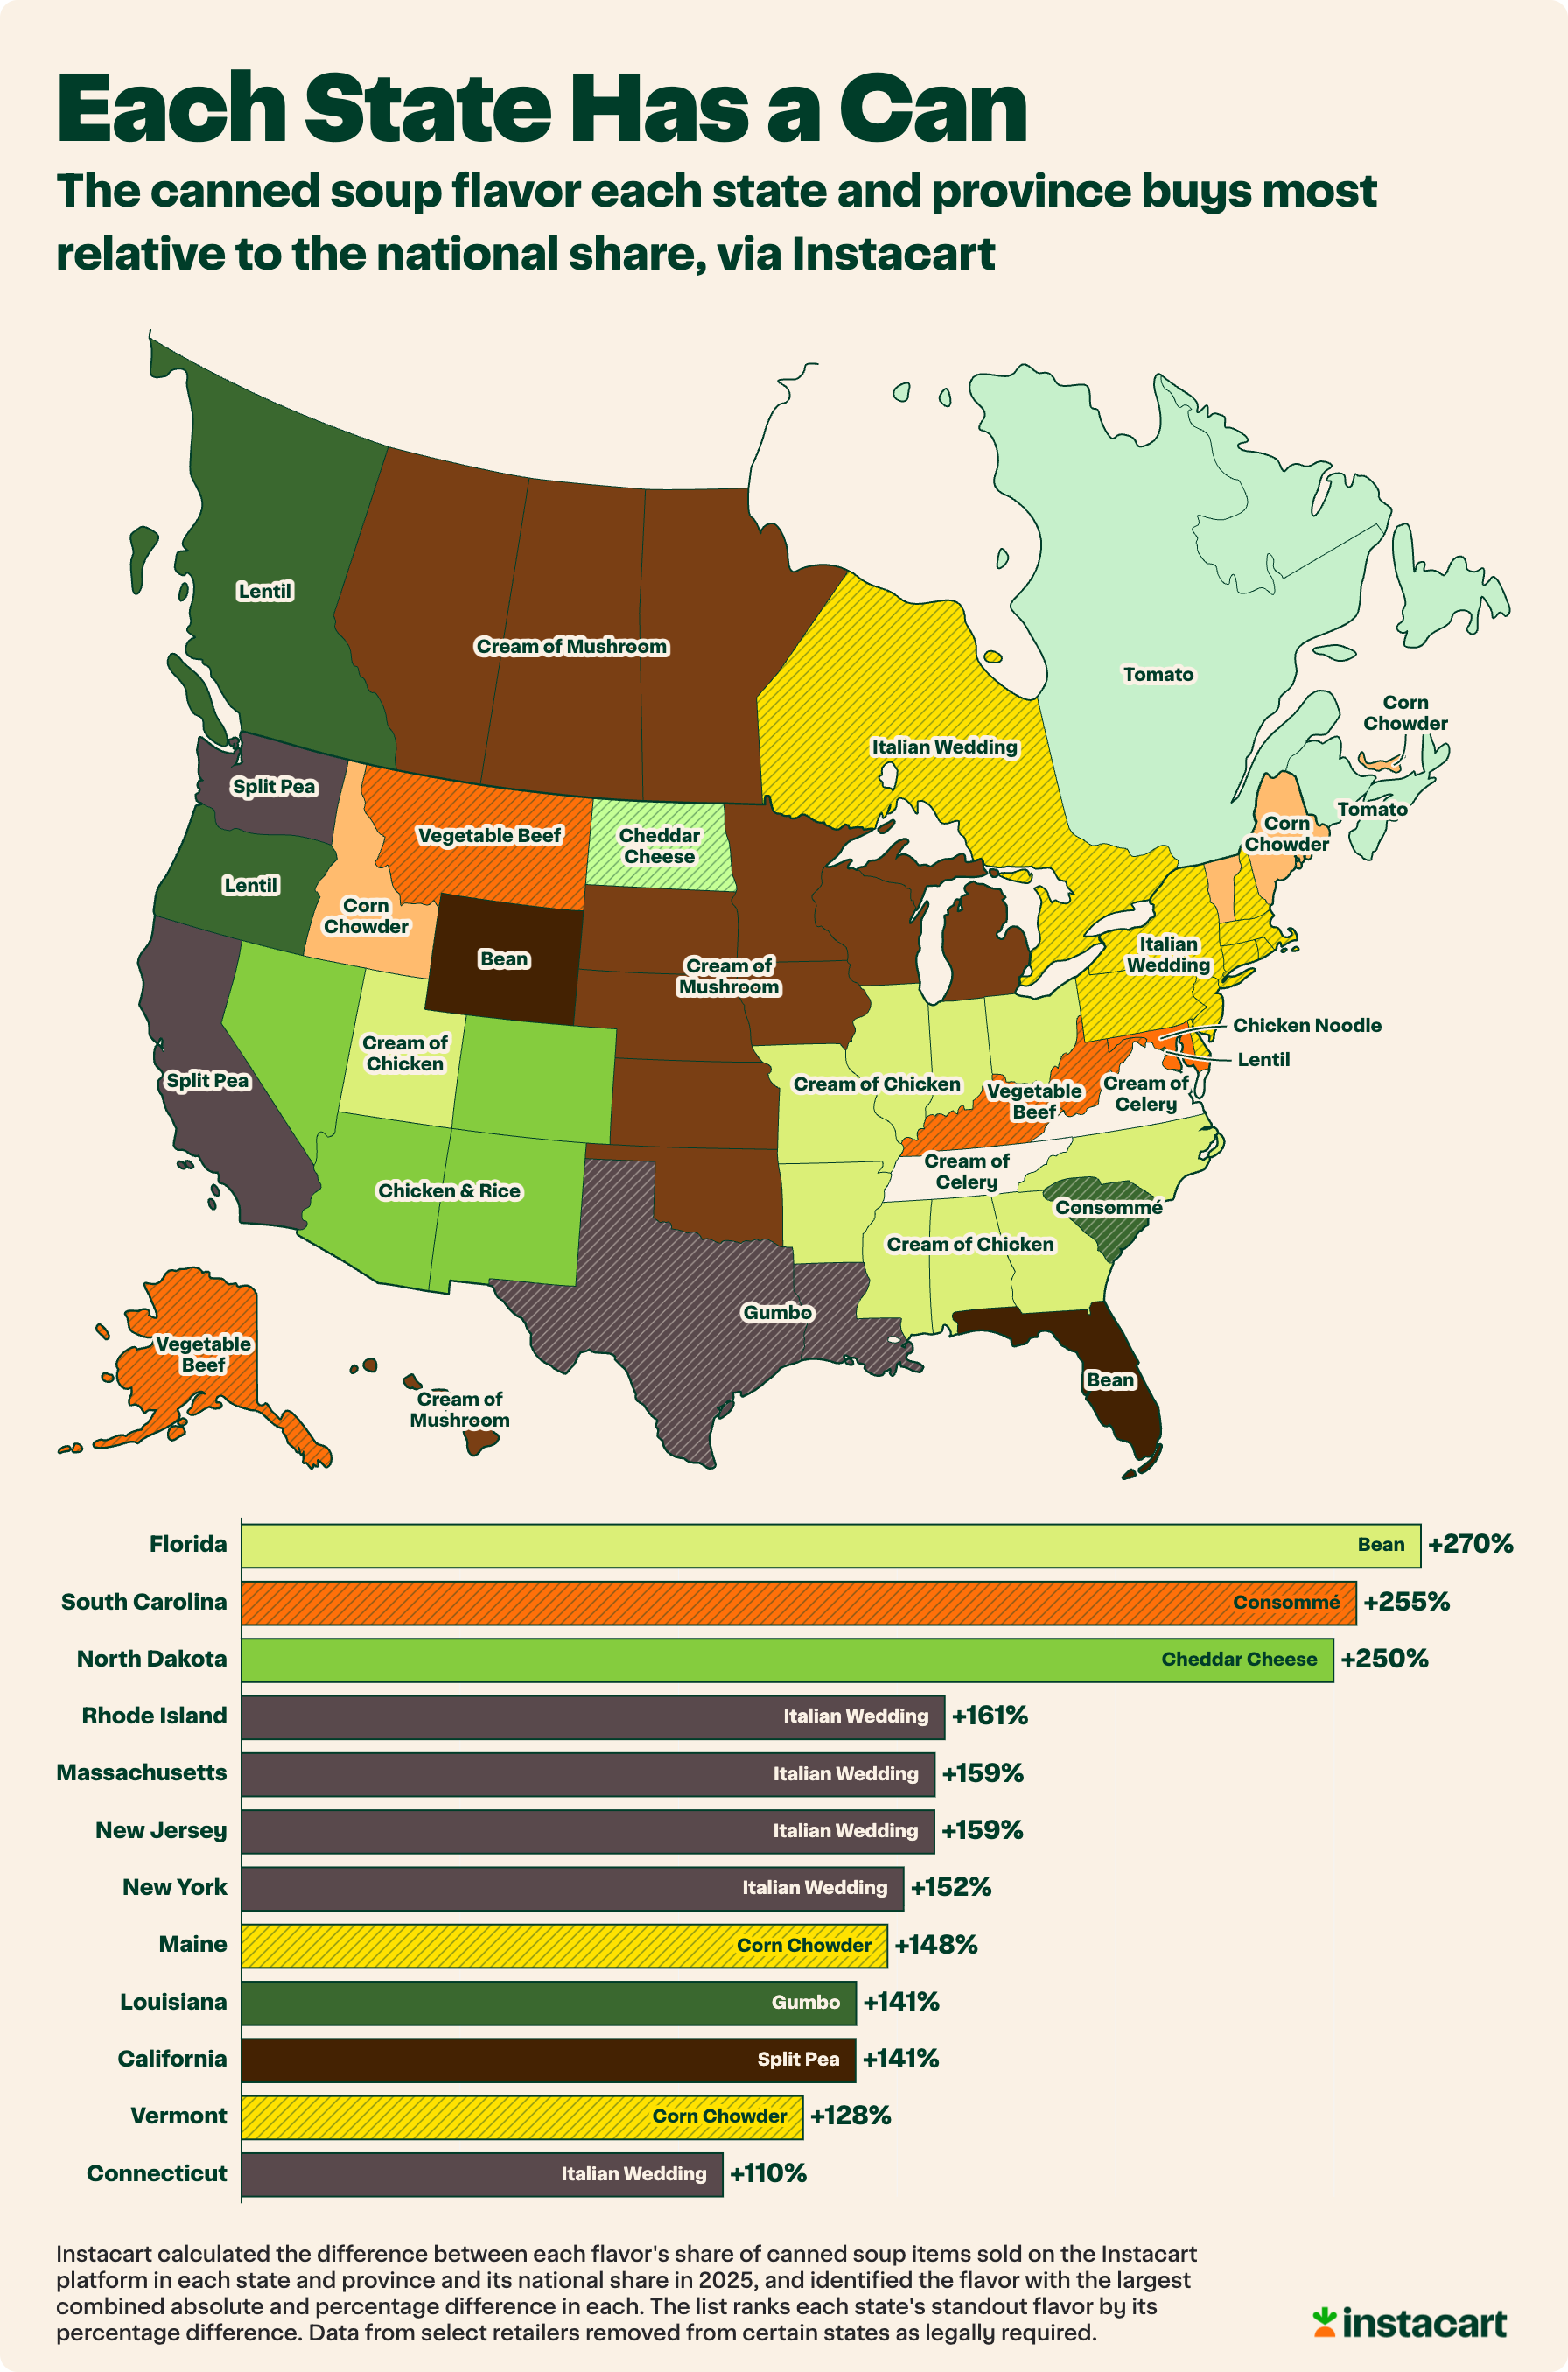
Being No. 1 mostly comes down to overall popularity, so we also looked at which can each state buys far more of than the rest of the country. Cream of Mushroom is the standout in 12 states and provinces, from Iowa and Minnesota up through the Prairies (and, somewhat unexpectedly, Hawaii). Cream of Chicken takes 10, mostly across the South.
Then come the regional specialties. Italian Wedding is the standout from New Hampshire down to Delaware (plus Ontario), and Corn Chowder leads in Maine, Vermont, Idaho and Prince Edward Island. The biggest personalities belong to South Carolina, which buys Consommé at +255% the national share, North Dakota with Cheddar Cheese soup (+250%), and Rhode Island with Italian Wedding (+161%).
Surely New England Owns Chowder? 🦪
Not quite. Clam chowder over-indexes in New England (Massachusetts and Connecticut are both +68%, New Hampshire +60%), but the two states that buy it most often relative to the rest of the country are on the other coast: Washington (+83%) and Oregon (+80%).
What Does Each Can Travel With? 🛒
Each of the top cans has a sidekick. Orders with clam chowder are nearly 16x as likely to include oyster crackers (+1,483%). Chicken Noodle carts lean sick day, with saltines (+859%) and cold & flu medicine (+540%).
Tomato soup travels with sliced cheese (+224%) and sourdough (+202%), which sounds a lot like grilled cheese. And orders with Cream of Chicken are nearly 12x as likely to include egg noodles (+1,073%). Creamy chicken noodles, anyone?
The Last Spoonful 🥣
So whether you're stocking up on Cream of Mushroom for the green bean casserole, keeping a can of Chicken Noodle (and the saltines) ready for a sick day, or pairing Tomato soup with a grilled cheese, soup season is just about here... unless you're in Idaho, there you might already be late. Don't worry, Instacart has you covered. 🍂