.png%3Fwidth%3D2688%26auto%3Dwebp%26quality%3D80&w=3840&q=75)
Ask anyone what summer tastes like and you'll get a different answer. A perfectly ripe peach. Sweet corn straight off the grill. Watermelon at a Fourth of July cookout. The list is different for everyone, but the euphoric feeling of biting into something at peak ripeness is the same. These are the flavors people wait all year for, and Instacart order data shows just how seriously Americans take them.
We analyzed fresh produce orders from U.S. grocery retailers across 2023–2025 and commissioned The Harris Poll to survey over 2,000 Americans to map what's actually happening in the summer produce aisle – including when different categories peak, where they peak hardest, and just how much people care about their summer fruits and veggies. Spoiler: it’s a lot.
Key Takeaways
Stone fruit is the main event of summer. The week of August 12 is the single most dramatic week on the entire summer produce calendar – Donut Peaches (+378%), White Peaches (+292%), White Nectarines (+333%), Pluots (+439%), and Plums (+172%) all hit their 2025 highs in the same 48-hour window. No other week comes close.
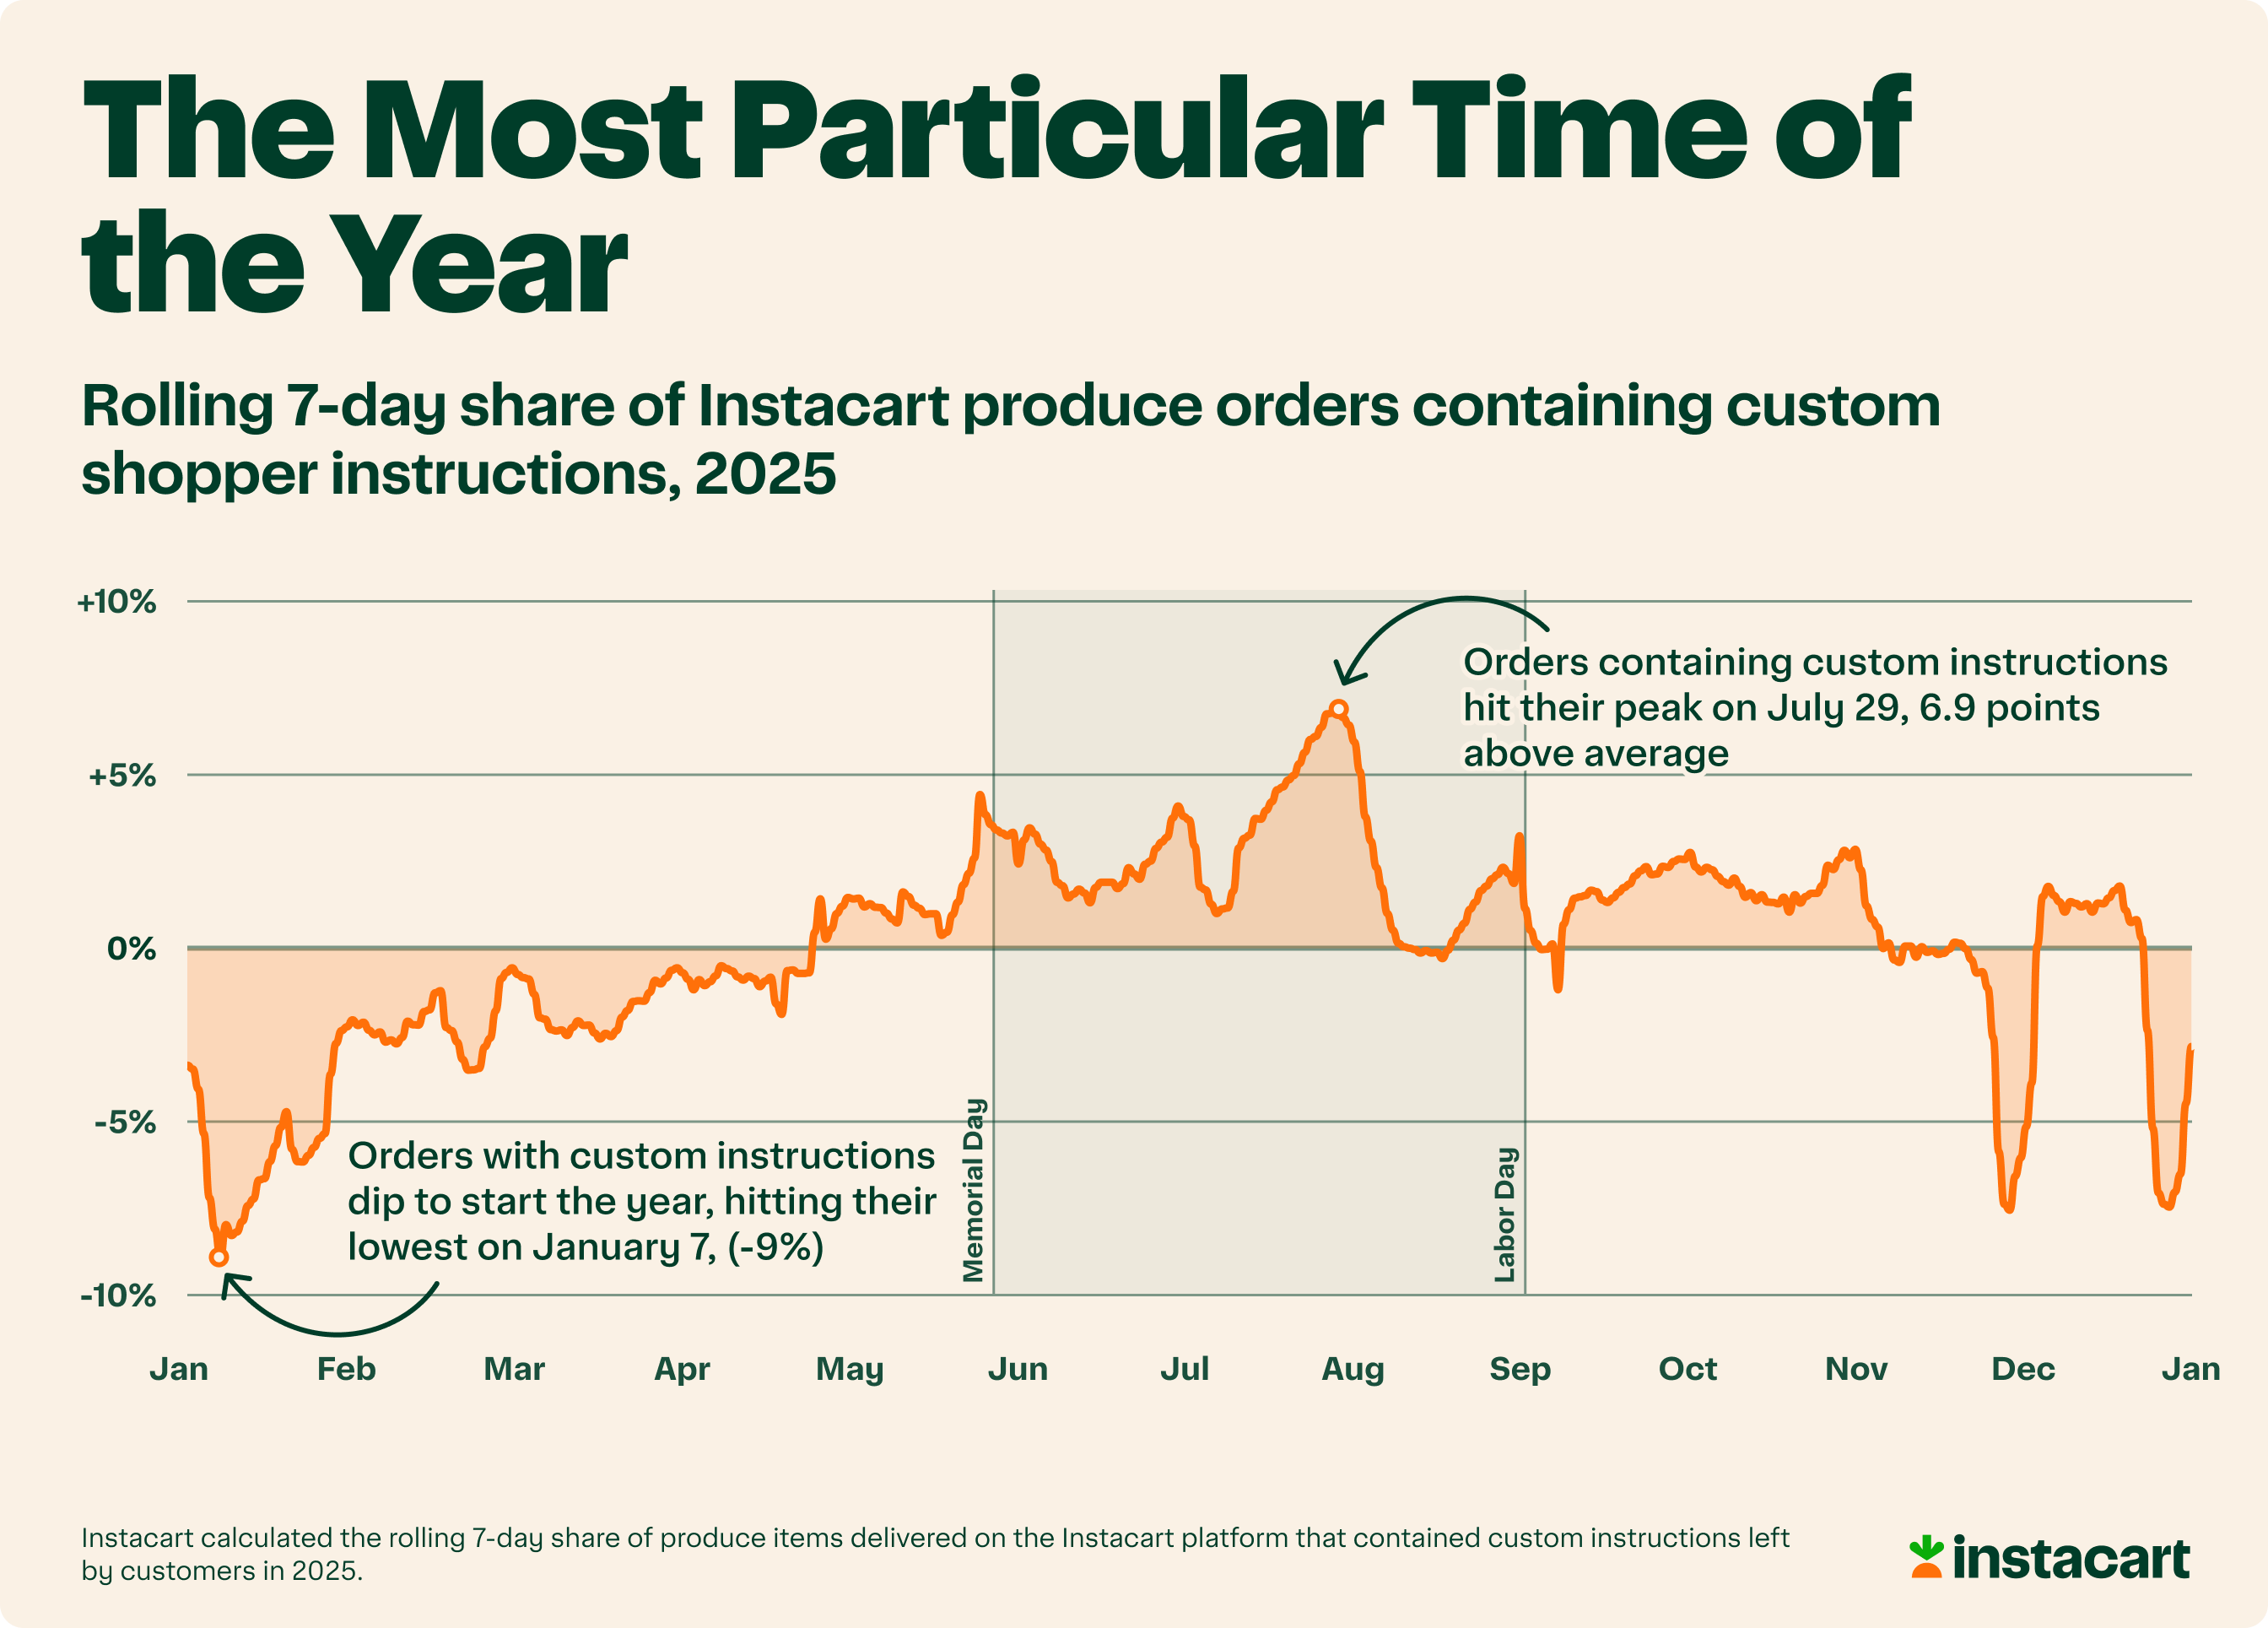
Americans have strong feelings about their stone fruit. The share of produce orders with hand-typed customer instructions swings 16 percentage points from its January low to its late-July peak. A May 2026 Instacart/Harris Poll survey found 35% of Americans say a perfectly ripe peach beats any other summer dessert, and 62% identify as Team Peach versus Team Nectarine (18%). Opinions about stone fruit are a seasonal phenomenon.
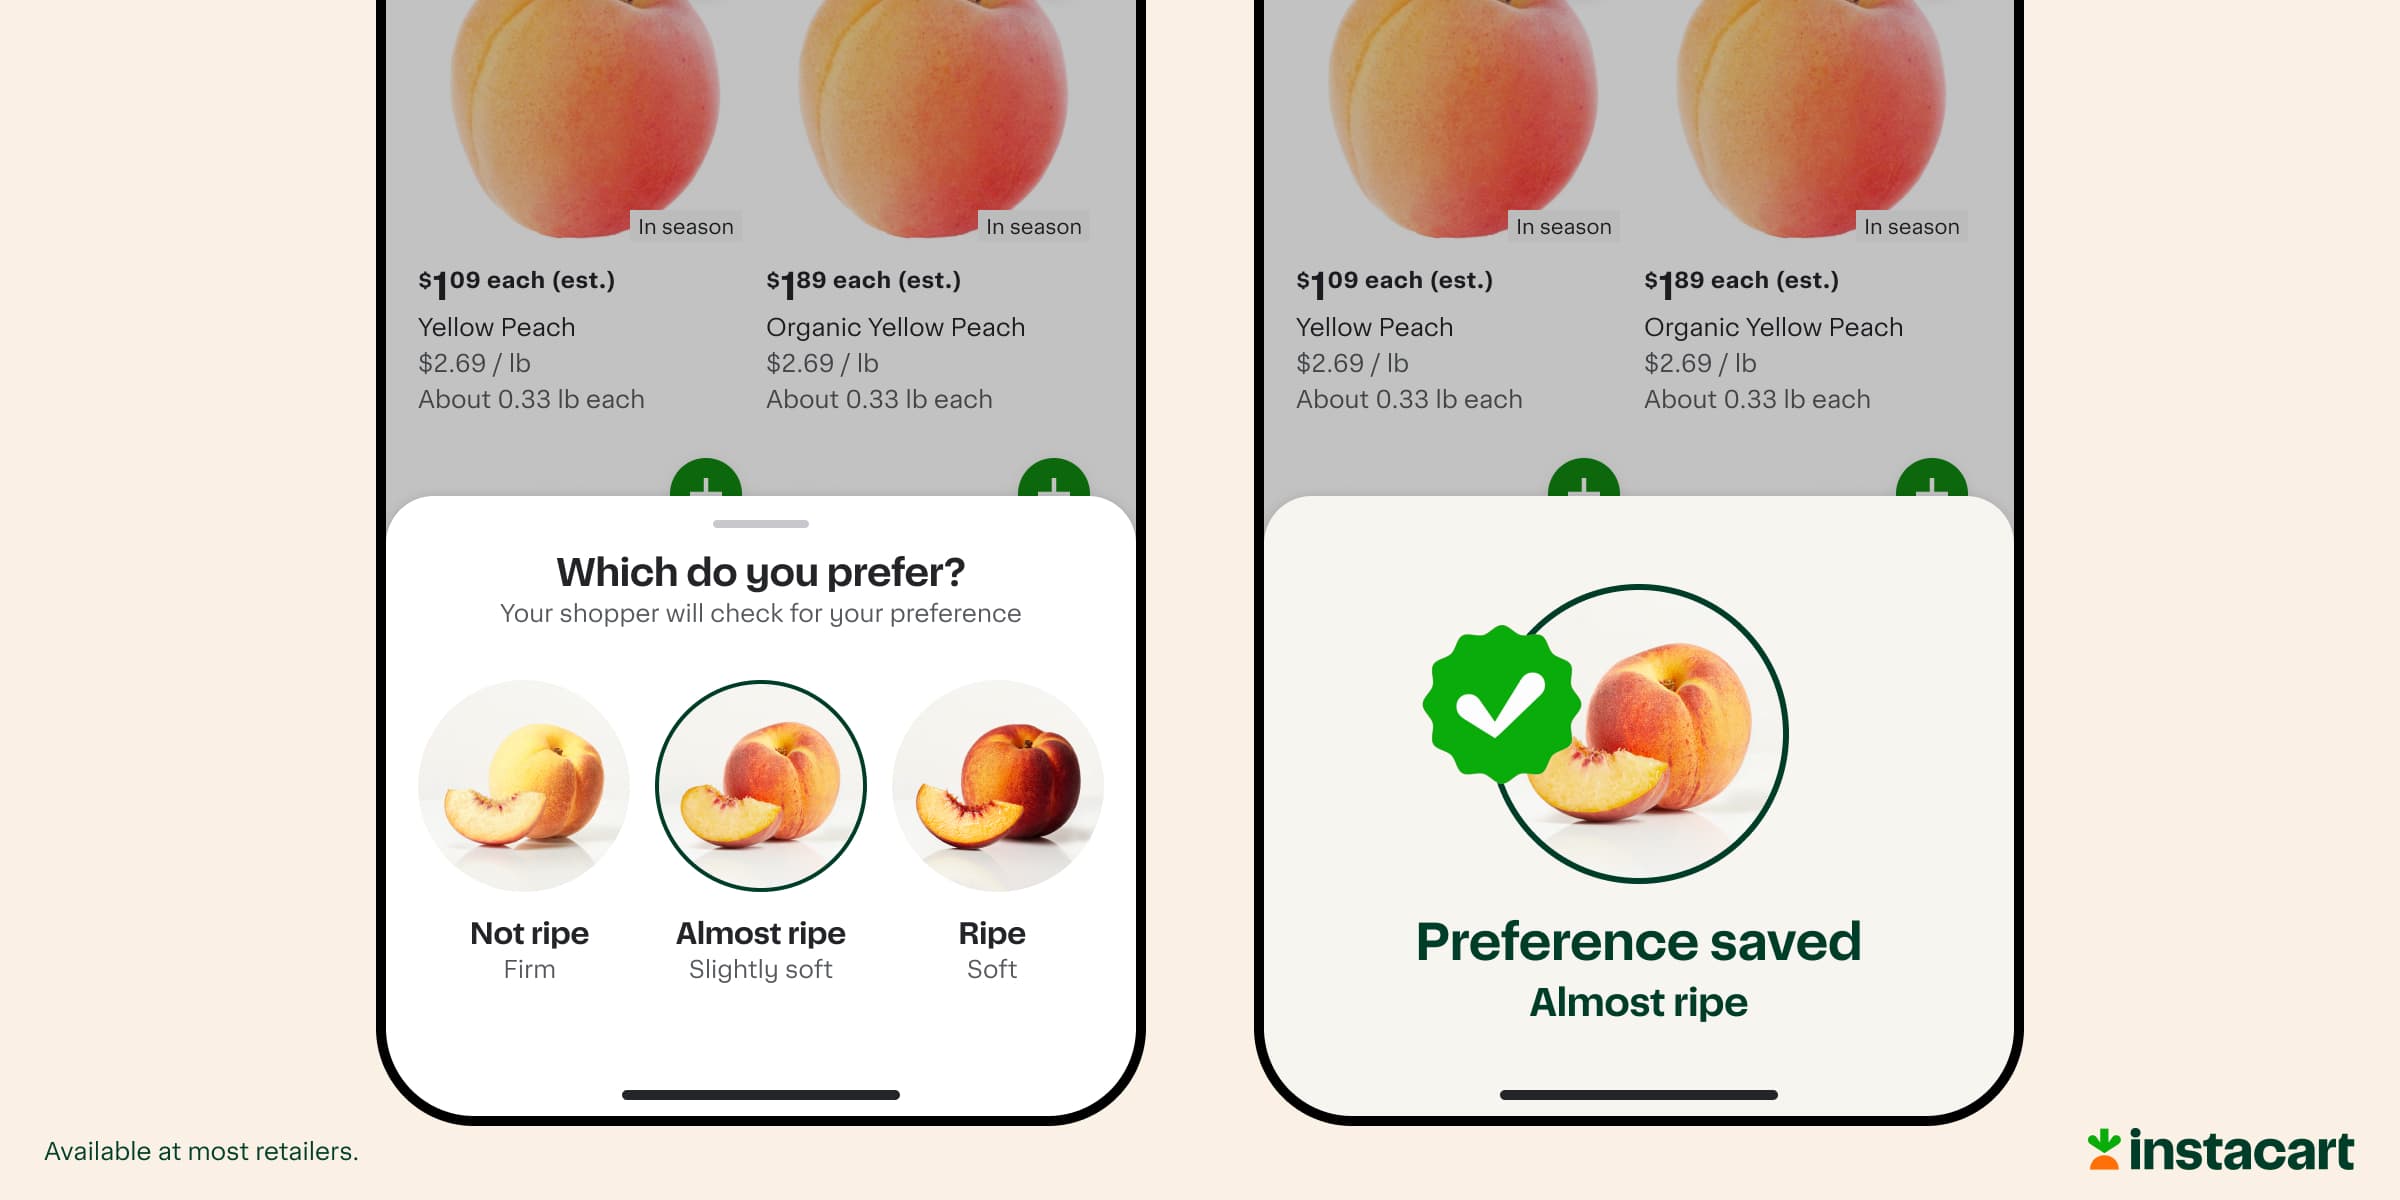
Peaches are now live with Preference Picker. Customers can now set their peach ripeness preferences – from "not ripe" to "almost ripe" to "ripe” – upfront, so their Instacart shopper knows exactly what to reach for, giving them even more control over their groceries.
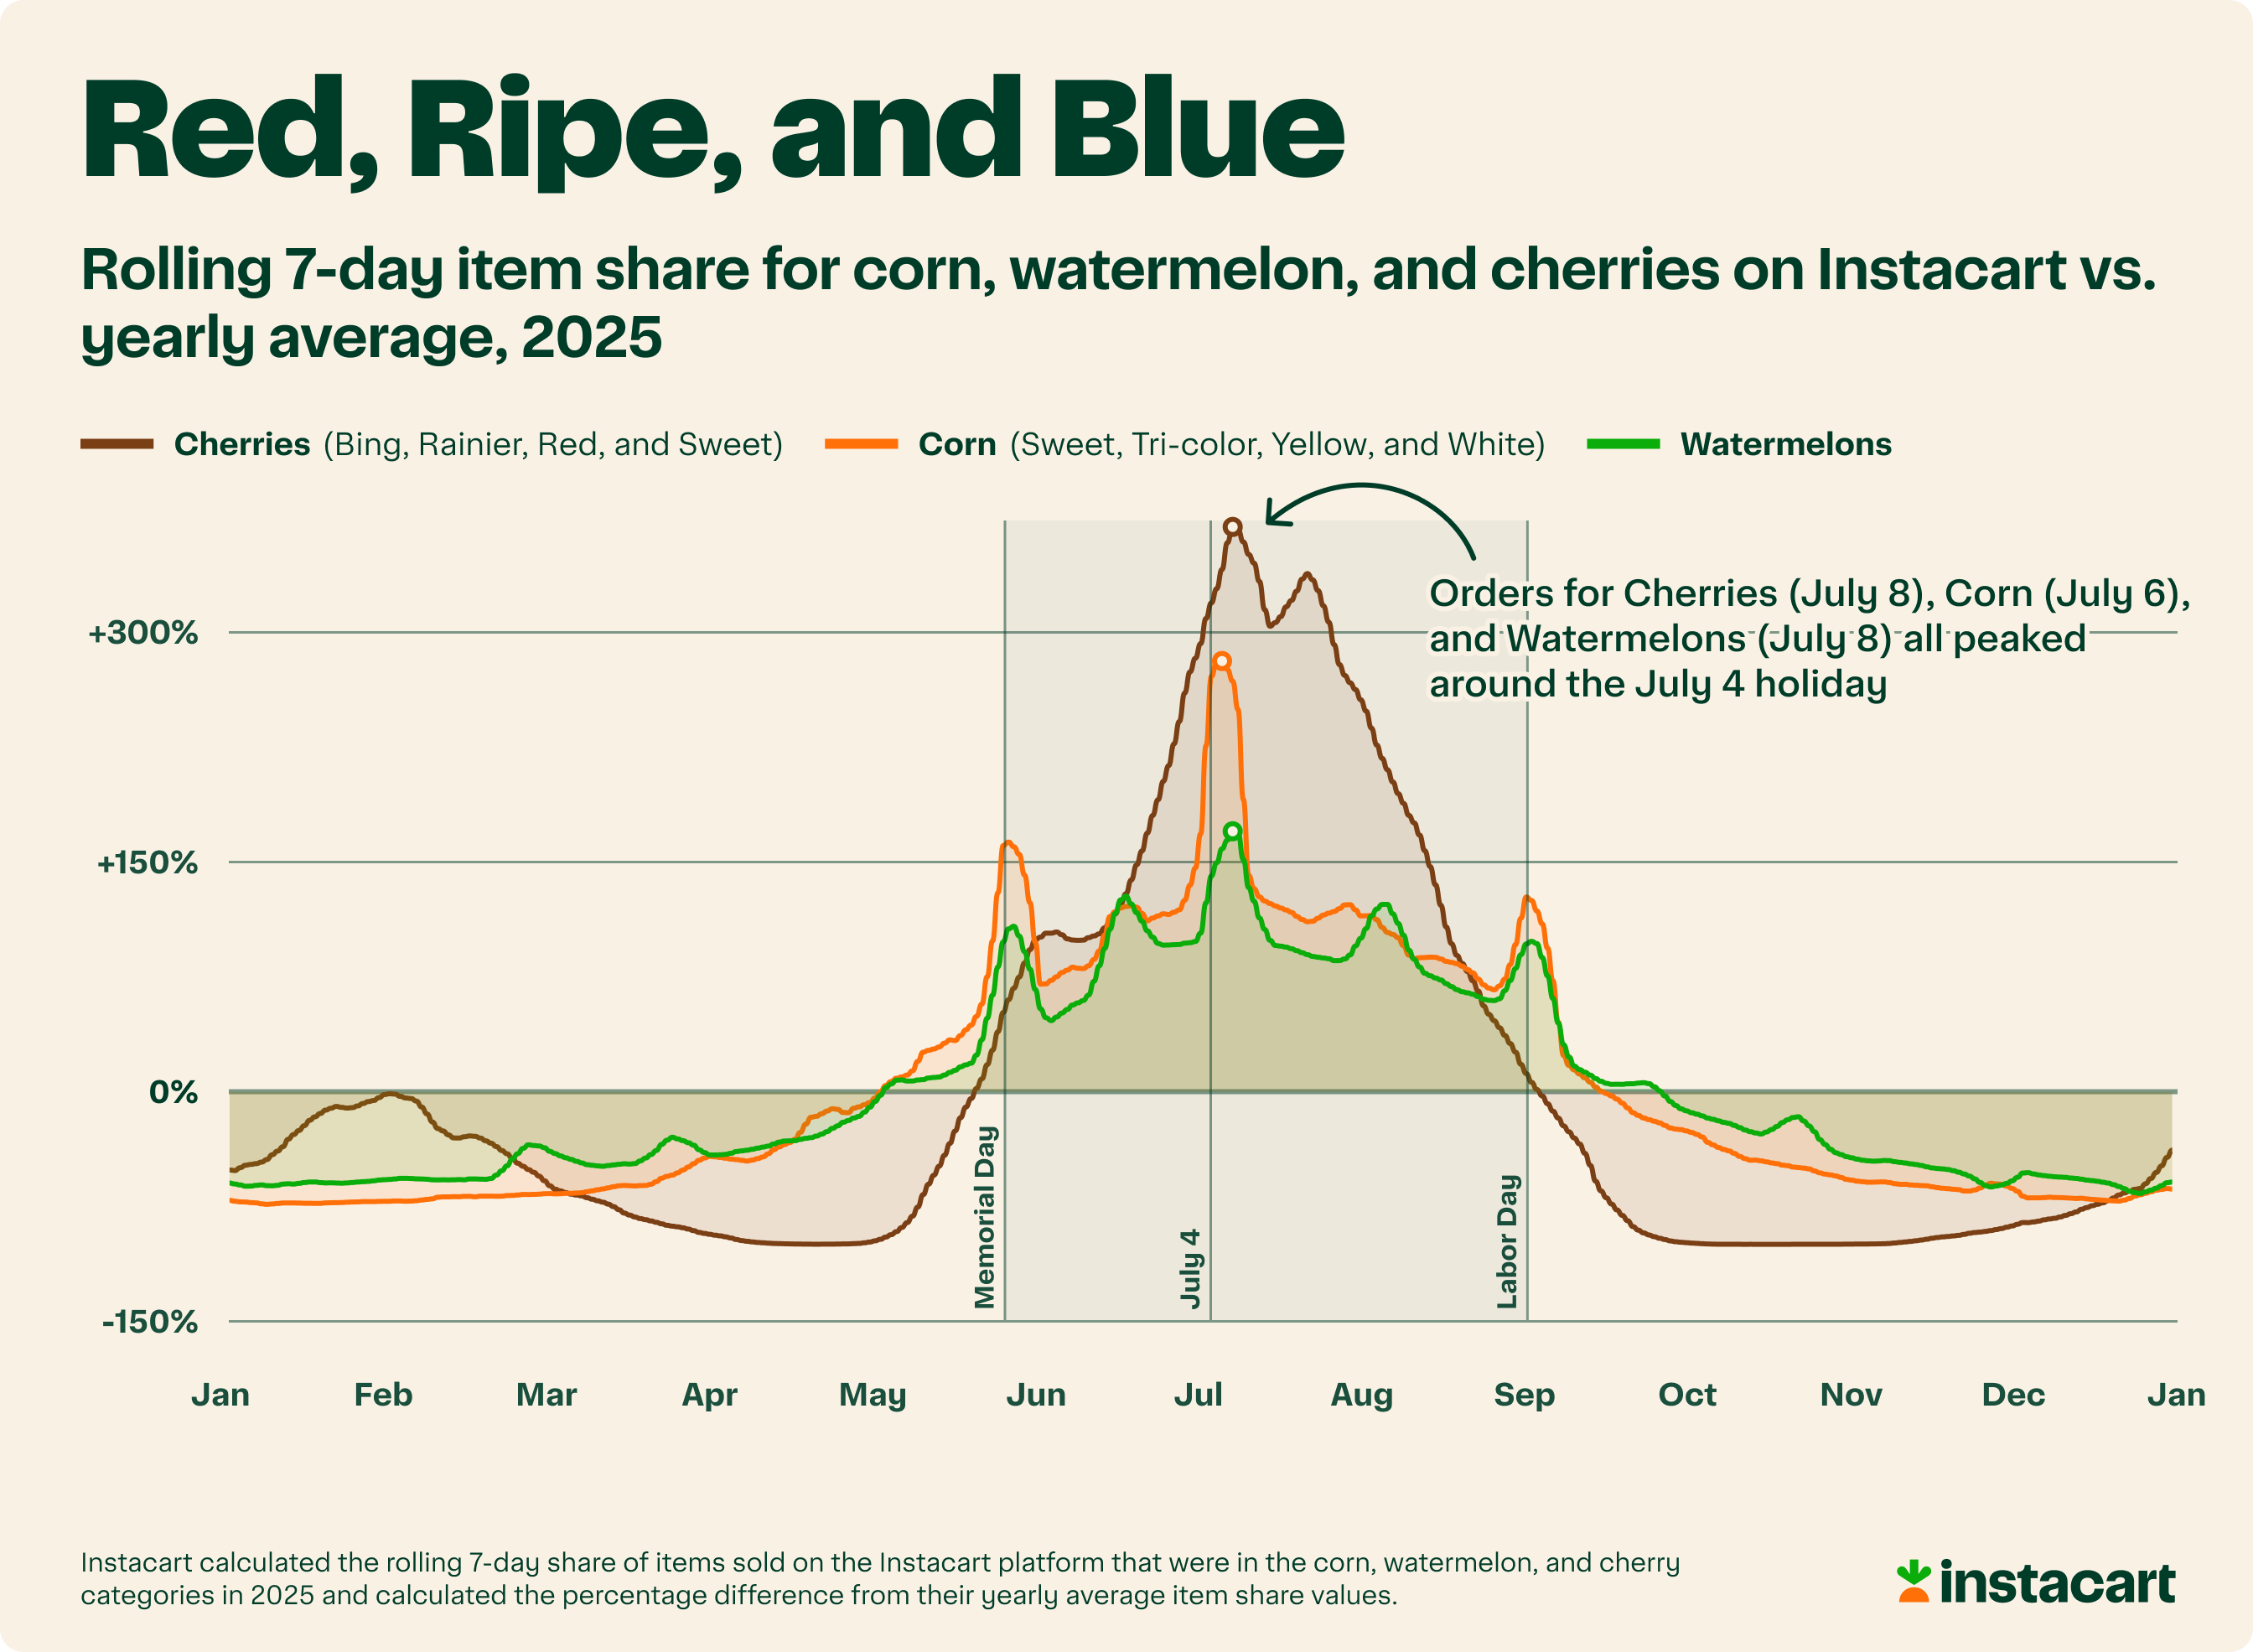
The Fourth of July is a big moment for produce. Sweet Corn (+263%), Yellow Corn (+327%), White Corn (+292%), Tri-Color Corn (+293%), Watermelon (+170%), and Cherries (+369%) all peaked within a four-day window around Independence Day.
Every state has its thing. Vermont over-indexes on Corn at +40%. Maine leads the country on Heirloom Tomatoes. Muscadine Grapes spike almost entirely in Georgia and the Carolinas.
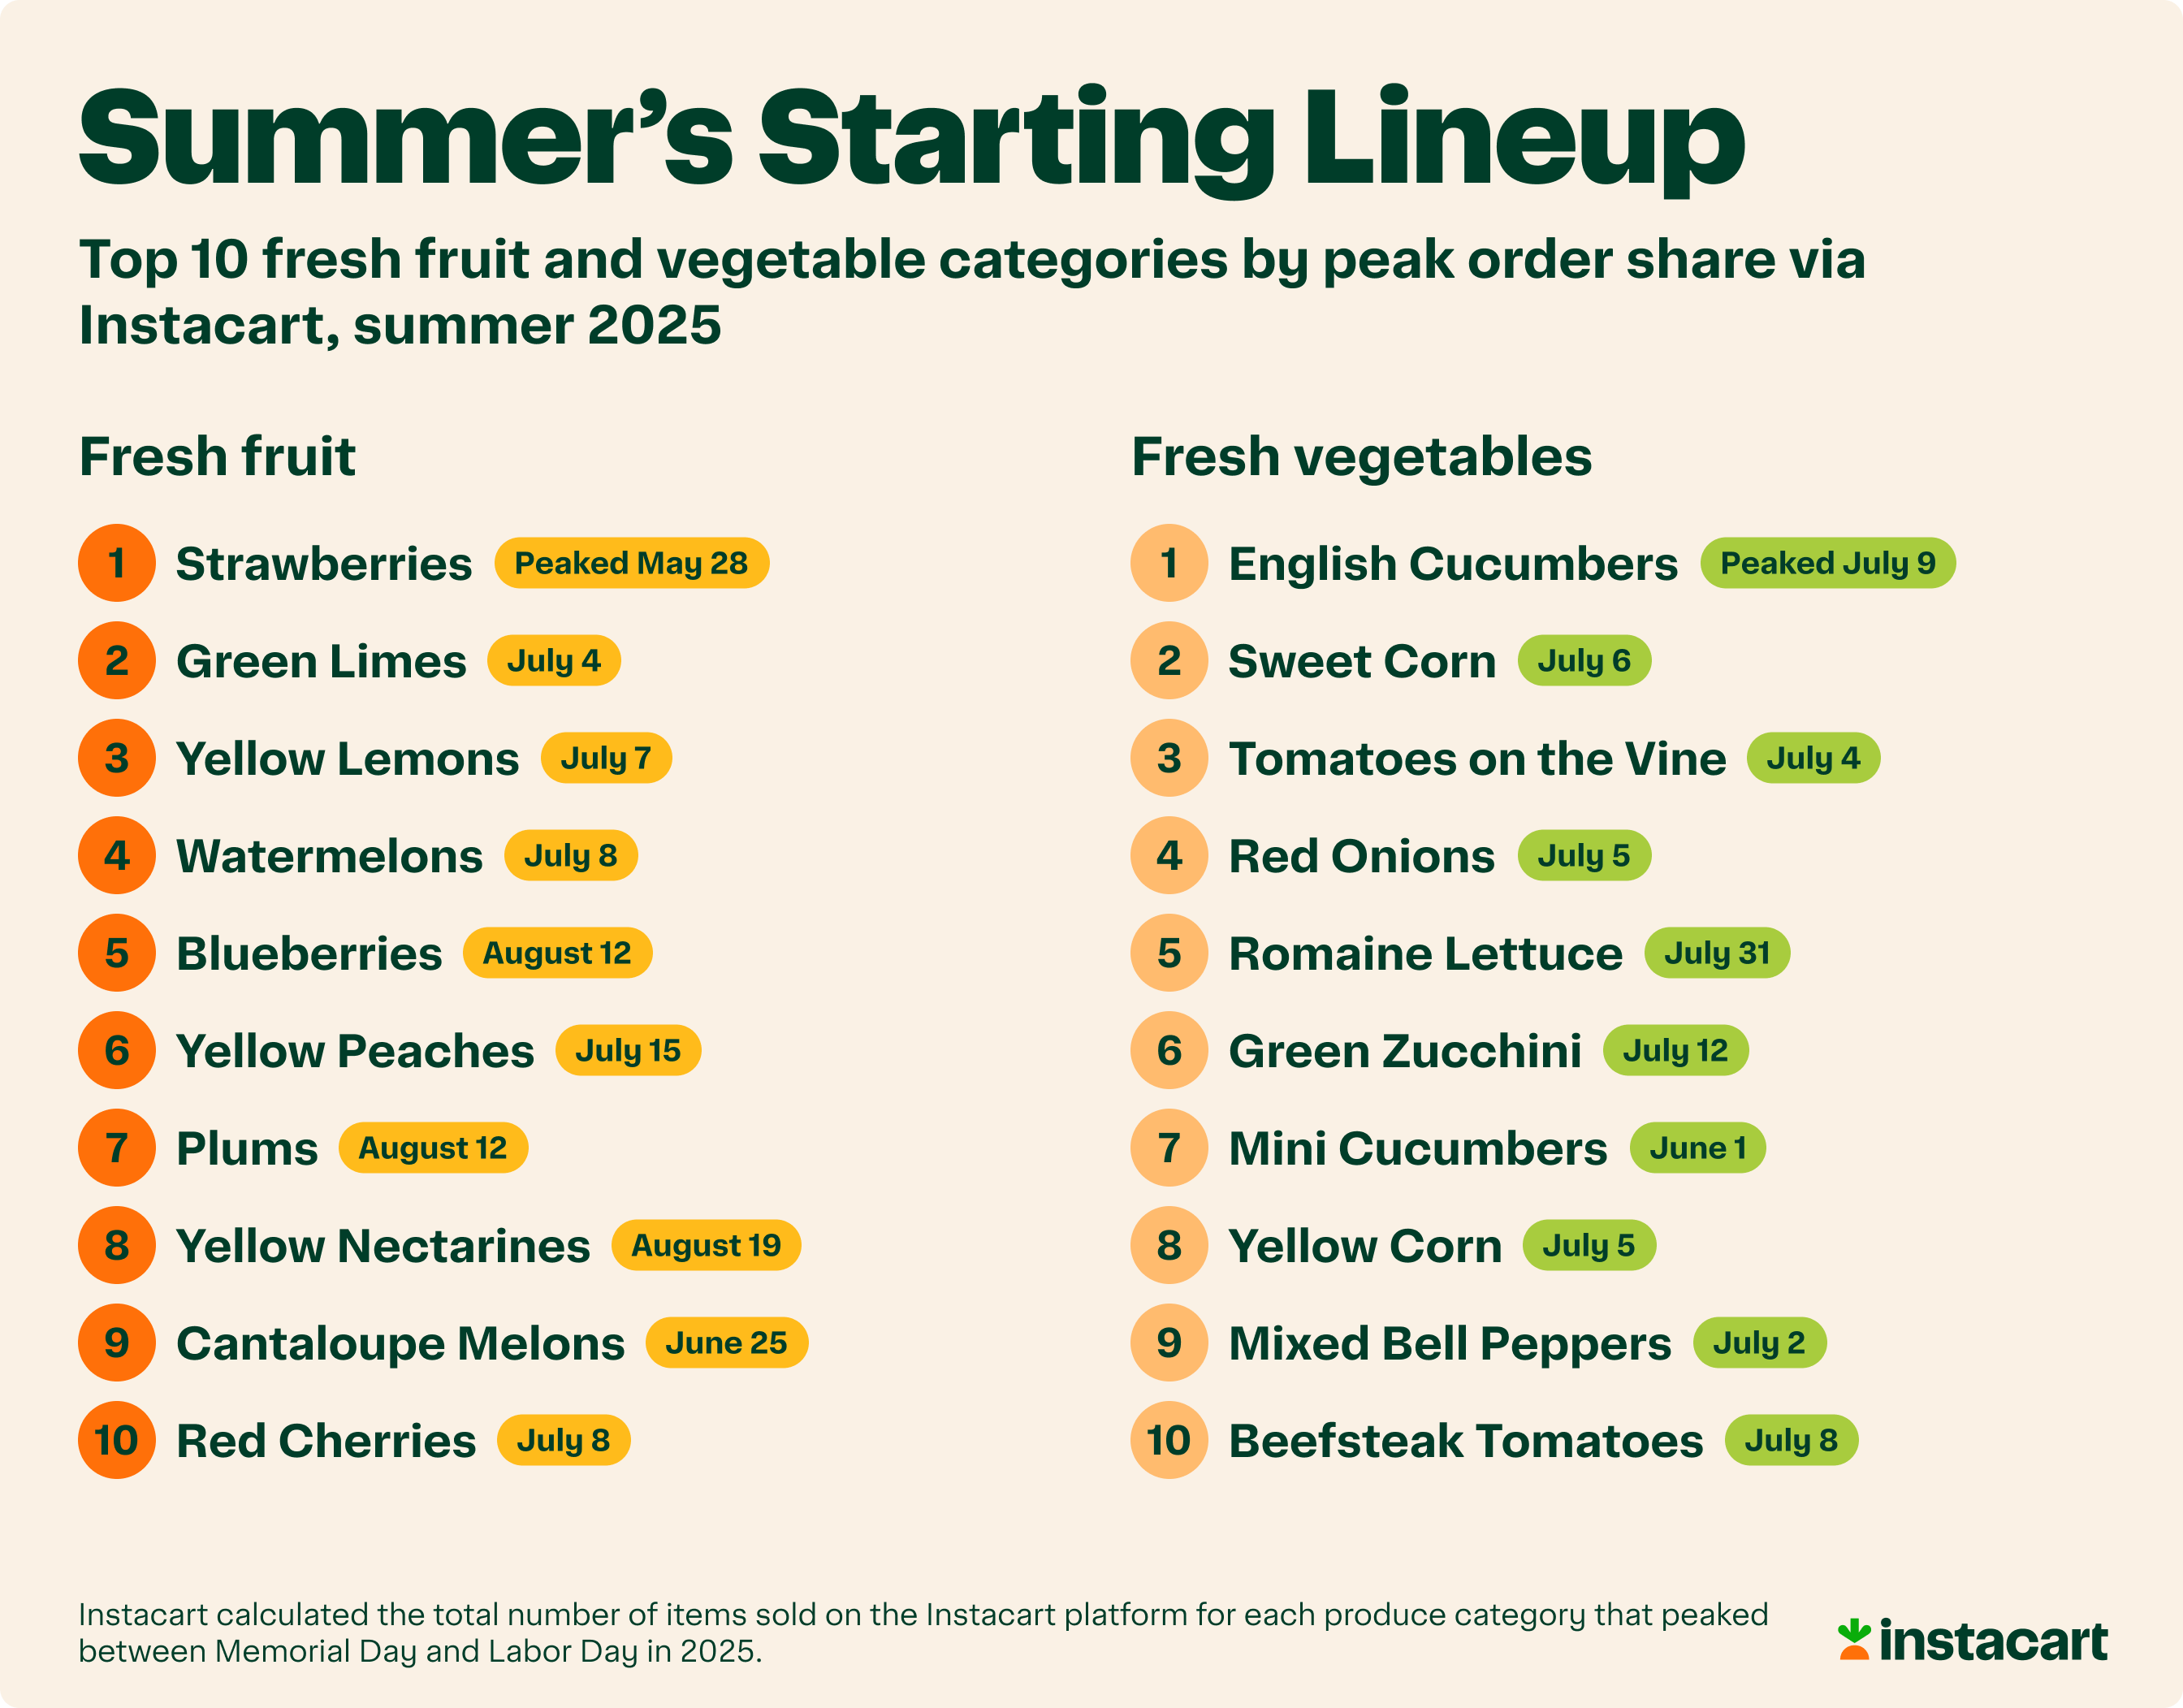
Summer's Biggest Produce Categories
Here's the starting lineup. These are the fruits and vegetables that captured the largest share of Instacart baskets at their summer peaks. Strawberries lead the fruit side and stone fruit makes a strong showing throughout, a preview of the August crescendo to come. Meanwhile, sweet corn, yellow corn, and everything you need for a great summer salad dominate the vegetables.
The Fourth of July Produce Lineup
Every Fourth of July, Americans fire up the grill…and stock up on produce. Corn, watermelon, and cherries show up in a big way year after year, peaking in near-perfect unison over the long weekend.
Corn Takes Over – Over the long, festivity-filled weekend, four varieties of corn peaked within just a few days of each other:
Tri-Color Corn: +293% on July 5
Yellow Corn: +327% on July 5
Sweet Corn: +263% on July 6
White Corn: +292% on July 7
.png)
Turns out corn on Instacart is a New England thing, not a Midwest thing. Vermont (+40%), Maine (+29%), and Connecticut (+22%) are among the states leading the country – while Iowa, the heart of the American Corn Belt, comes in at -37% below the national average. Make it make sense.
Watermelon: The Southwest's Unofficial Juicy Side Dish – Watermelon’s summertime peak arrived on July 8 at +170%, with southwestern states leading the charge on orders:
Nevada: +36%
Texas: +35%
Wyoming: +25%
California: +24%
Turns out the states with some of the hottest summers also have the best watermelon instincts.
Cherries: A Quintessential Cookout Snack – Cherries hit their peak on July 8 at +369% – the single biggest produce spike of the entire long weekend, because what’s more patriotic than a bowl of perfectly in-season red cherries?
It’s Stone Fruit Summer, Starting with Peaches.
If corn, watermelon, and cherries own the Fourth of July, stone fruit owns the rest of summer.
The Peach Takeover – Yellow Peaches kick things off the week of July 15, spiking +214% above their yearly average – with southwestern states going all in:
New Mexico: +83%
Utah: +45%
Arizona: +42%
.png)
What Americans Actually Think About Peaches – The Instacart/Harris Poll survey captures just how much peach season means to people, and the strong opinions that come with it:
62% of Americans identify as Team Peach – vs. just 18% Team Nectarine
35% say a perfectly ripe peach beats any other summer dessert
41% of Americans who eat peaches say if they got their hands on a perfect peak-season peach, they'd eat it immediately –- right where they're standing 😮
51% of Americans who eat peaches like to eat it bite by bite, juice everywhere
26% of Americans who eat peaches say they like to eat them at room temperature – refrigerating a peach is a crime
Just when you think stone fruit season has peaked with peaches, the week of August 12 arrives and creates an unmissable moment with five categories peaking within 48 hours (per Instacart purchase data), making one very delicious fruit bowl:
Donut Peaches: +378% vs. the yearly average on 8/12
Pluots: +439% on 8/12
White Nectarines: +333% on 8/12
Plums: +172% on 8/12
White Peaches: +292% on 8/13
Methodology: Instacart calculated the peak rolling 7-day window that had the highest share of items sold on the Instacart platform in 2025 for each type of produce, as well as the percentage difference from its yearly average share of items sold during that peak period.
This is the single most dramatic week for summer produce.
Getting Particular About Produce – The custom instruction data tells the same story in a different way. In early January, the share of produce orders with hand-typed customer instructions sits 8.9 percentage points below the yearly average. People are ordering onions, but few people have strong feelings about their onion’s ripeness.
By the week of July 29 – right in the thick of peach season – that number climbs to 6.9 points above average. That's a 16-point swing from "no preference” to "please select slightly underripe, but not squishy since I'm eating these on Friday."
Every State Has its Produce Quirks. Here Are Some of Our Favorites.
The national numbers tell one story, but the state maps tell fifty more.
Vermont is the most corn-obsessed state in America, full stop. Vermont over-indexes +40% above the national average. Maple syrup gets all the attention, but perhaps corn is the real state obsession.
New Mexico shows up near the top of nearly every summer produce category – leading the country on Pluots (+468%) and Yellow Peaches (+83%) – and is also ground zero for Hatch Chile Pepper season, which spikes +280% nationally in mid-August. No state goes harder on summer produce.
Maine leads the entire country on Heirloom Tomatoes at +151% above the national average – ahead of California (+146%) and Florida (+128%). The Pine Tree State has a very strong affinity for fancy tomatoes, and we respect it.
D.C. over-indexes on Sweet Cherries at +168% above the national average. The capital definitely has a thing for cherries, whether it's cherry (blossom) trees or cherry fruit.
Hawaii leads the country on Lychees (+563%) and Sugar Kiss Melons (+312%), and ranks near the top for Rambutan (+315%), White Nectarines (+86%), and White Peaches (+119%). Tropical fruit makes sense, but the stone fruit obsession is a pleasant surprise.
And then there's Georgia and the Carolinas, which are in a category entirely their own. Muscadine Grapes – a thick-skinned, intensely sweet variety native to the American Southeast – spike +696% (Georgia), +564% (North Carolina), and +286% (South Carolina) above the national average the week of August 27. They barely register nationally for most of the year, then arrive like a freight train in late summer, almost entirely concentrated in these few states.
Methodology: Instacart calculated the percentage difference between the state and national share of items sold on the Instacart platform for each produce category in 2025.
Introducing Preference Picker for Peaches
The 16-point swing in customer instructions isn't just a fun data point, it's a signal – one that the Instacart team has been paying attention to for a while.
Preference Picker – part of Instacart's Grocery Quality Controls, a suite of in-app tools designed to help your shopper find exactly what you're looking for – is expanding. Already available for everyday staples like avocados, bananas, and deli meat, Preference Picker now covers peaches, with additional summer produce categories like mangos, tomatoes, plums, pluots, apricots, and pears rolling out on July 15. Set your ripeness preferences – from "not ripe" to "almost ripe" to "ripe" – before you even add items to your cart, and your Instacart shopper will know exactly what to reach for.
Preference Picker for peaches is available today across most retailers on the Instacart Marketplace – just in time for the best weeks of stone fruit season. 🍑
Here's to a summer full of perfect peaches, sweet corn, and every other seasonal fruit and veggie worth waiting for. Get your summer produce delivered just how you like by visiting www.instacart.com/store/pages/summerproduce. 🍑🌽🍉
Survey Method:
The Instacart/Harris Poll survey was conducted online within the United States by The Harris Poll on behalf of Instacart from May 12-14, 2026, among 2,045 adults ages 18 and older, among whom 1,904 eat peaches. The sampling precision of Harris online polls is measured by using a Bayesian credible interval. For this study, the sample data is accurate to within +/- 2.7 percentage points using a 95% confidence level. This credible interval will be wider among subsets of the surveyed population of interest. For complete survey methodology, including weighting variables and subgroup sample sizes, please contact press@instacart.com.